AWS 207: CloudWatch dashboards and synthetic monitoring
Why this lesson matters
Dashboards make a shared operating story visible; canaries generate controlled outside-in evidence even when no real user is active. Neither replaces alerting or real-user telemetry. A dashboard can confidently display the wrong Region or aggregation, and a canary can pass a shallow health page while checkout is broken. This lesson connects each widget and synthetic step to a user outcome, owner and response.
What you will be able to do
By the end, you can:
- design a service dashboard around availability, latency, errors and saturation rather than resource count;
- verify account, Region, period, statistic, units and time zone for every widget;
- distinguish automatic dashboards, custom dashboards and cross-account observability;
- define a safe canary journey with assertions, test-data ownership, secrets handling and cleanup;
- correlate canary run, screenshots/artifacts, logs, metrics, traces and application evidence;
- explain public, VPC and multilocation canary network boundaries;
- diagnose a failed run without treating the canary runtime as the application.
Before you start
- Use a personal AWS account only when its owner has approved the lesson. Do not use the root user for daily work.
- CloudShell is the default command environment. AWS028 explains CloudShell; AWS029 and AWS030 explain local AWS CLI installation and profiles.
- The course example Region is
ap-south-1. Global services and services with a required control Region are called out in their commands. - Run
aws sts get-caller-identityprivately. Redact the account number before sharing evidence. - Never paste access keys, passwords, secret values, private object data, presigned URLs, or full account-specific ARNs into a submission.
- This is a no-create lesson. Every Console action and AWS CLI command is read-only. Create the practical artifact locally.
- Console wording can change. Use the Console service search if a menu label has moved, then confirm the current field in the official documentation.
The core model
| Question | What it means in this lesson |
|---|---|
| Purpose | Combine a small service-level dashboard with CloudWatch Synthetics canaries that test a user path, not just infrastructure existence. |
| Scope and boundary | For CloudWatch dashboards and synthetic monitoring, separate account and Region scope, identity, configuration, data or network behavior, failure ownership, evidence retention, and cleanup. |
| Evidence of success | Success requires matching Console, command-line, behavior, monitoring, and owner evidence for CloudWatch dashboards and synthetic monitoring. One green status is not enough. |
| Cost model | Canary runs, Lambda runtime, artifacts, logs, custom dashboards, metrics, and retained S3 data can charge. |
| Safe rejection rule | Avoid real customer transactions, credentials in scripts, screenshots with private data, or dashboards containing every available metric. |
How the request flows
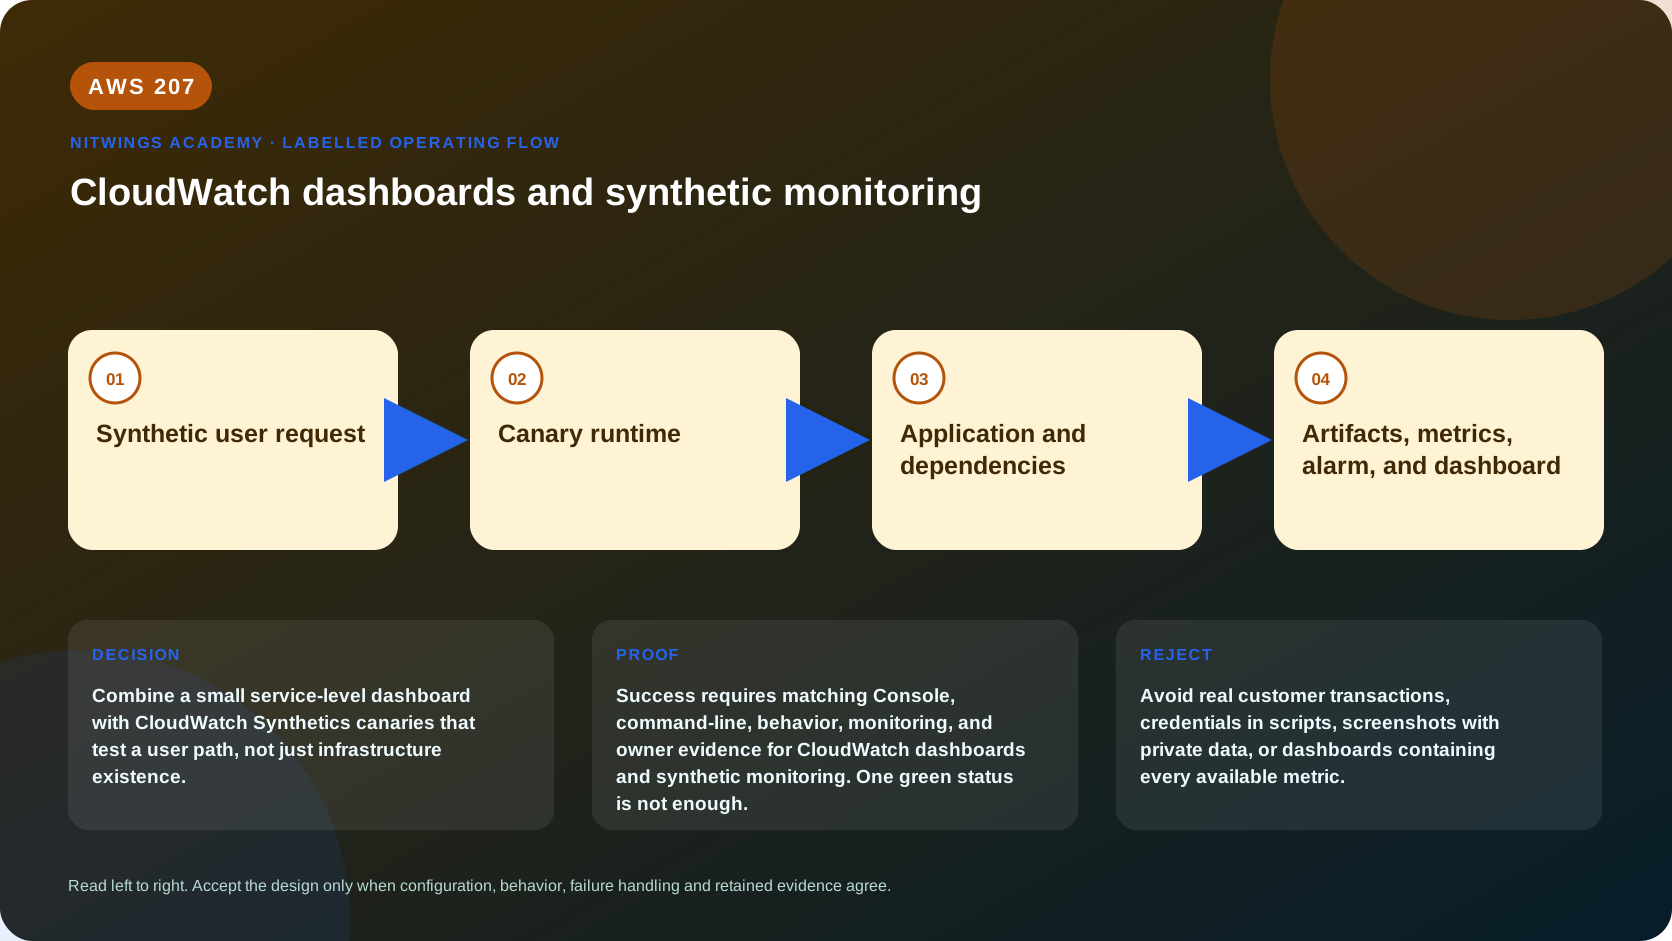
+--------------------------+
|  Synthetic user request  |
+--------------------------+
             |
             v
+----------------------+
|    Canary runtime    |
+----------------------+
           |
           v
+--------------------------------+
|  Application and dependencies  |
+--------------------------------+
                |
                v
+--------------------------------------------+
|  Artifacts, metrics, alarm, and dashboard  |
+--------------------------------------------+
Dashboard and synthetic design, deeply
Start from the service-level questions operators ask during an incident:
| Question | Candidate evidence |
|---|---|
| Can users complete the journey? | canary success rate and valid content assertion |
| How many requests fail? | error ratio, not only raw error count |
| How slow is it for most and worst users? | p50 plus p95/p99 latency with request volume |
| Is a dependency responsible? | per-dependency latency/error and trace links |
| Is capacity exhausted? | CPU, memory, queue depth, concurrency, connection/storage headroom |
| Did a change precede harm? | deployment/configuration annotations and UTC timeline |
Automatic dashboards supplied by AWS help discover resource metrics. A custom dashboard is an operator-owned JSON definition with widgets, metrics, math, logs queries, alarms, text/runbook links and variables. Dashboard display does not copy or change the source metric. Cross-account observability through Observability Access Manager can let a monitoring account view linked source-account telemetry within a Region; cross-Region dashboard/centralization choices have different data-movement and cost behavior. Always display account and Region context.
A Synthetics canary runs a script on a schedule using a managed runtime. It can call HTTP APIs or use a browser journey, publish success/duration metrics, write logs and place artifacts such as screenshots in S3. The script must assert business content - not merely status 200 - and use synthetic tenant/test data that cannot affect real orders. Store secrets in an approved secret service and grant only the canary role access; never embed them in code, environment screenshots or artifacts.
A VPC canary needs subnet, SG, DNS and egress paths for its target and AWS service endpoints. Multilocation canaries run replicas in selected Regions under one primary configuration and consolidate runs/metrics/artifacts in the primary Region, but each replica runs independently; VPC settings are configured per replica Region and tags are not automatically replicated. More locations improve geographic evidence and multiply runs, traffic and cost.
Architecture decision table
| Situation | Direction | Reason |
|---|---|---|
| Requirement matches | Use canaries for continuous outside-in testing of a critical journey and dashboards for shared operating context. | Select only after scope, behavior, security, recovery, operations, and price evidence agree. |
| Requirement does not match | Avoid real customer transactions, credentials in scripts, screenshots with private data, or dashboards containing every available metric. | Rejecting an attractive service is a valid architecture result. |
| No create permission or cost approval | Use supplied evidence and local design work | Learning does not depend on creating an hourly resource. |
| Existing resource is unknown or unowned | Inspect only, then stop | Never change or delete a resource merely because it resembles a course example. |
AWS Management Console, step by step
Sign in with the normal non-root learning identity. Write the expected starting state before opening the service.
- Open CloudWatch > Dashboards and one approved custom dashboard. Set an absolute UTC range, turn off automatic refresh for evidence capture and record every widget's account/Region.
- For each widget, open its source and verify metric/log query, dimensions, period, statistic, unit and y-axis. Label mixed axes explicitly and reject a widget with hidden scope.
- Open Application Signals > Synthetics Canaries and one approved canary. Record state, runtime version, schedule, timeout, success-retention settings, role, artifact bucket and VPC configuration.
- Open the latest successful and failed run. Compare step names, assertions, duration, HTTP details, screenshot/artifact, log stream and failure reason. Redact private payloads.
- Inspect the canary alarm and artifact-bucket lifecycle/KMS/public-block settings. Identify who rotates secrets and synthetic data.
- This lesson is read-only. Do not start a canary, alter its schedule, save a dashboard or create synthetic transactions without owner approval.
CloudShell and AWS CLI, step by step
Start with a known caller and Region:
export AWS_DEFAULT_REGION="ap-south-1"
aws sts get-caller-identity --query Arn --output text
aws configure list
Redact the account part of the ARN in shared evidence. Now run the topic queries:
aws cloudwatch list-dashboards --query 'DashboardEntries[].{Name:DashboardName,Modified:LastModified,Bytes:Size}' --output table
aws synthetics describe-canaries --query 'Canaries[].{Name:Name,State:Status.State,Runtime:RuntimeVersion,Schedule:Schedule.Expression}' --output table
aws synthetics get-canary --name replace-with-approved-canary \
  --query 'Canary.{Name:Name,Status:Status,Runtime:RuntimeVersion,Schedule:Schedule,Artifact:ArtifactS3Location,Vpc:VPCConfig,Role:ExecutionRoleArn}' --output json
aws synthetics get-canary-runs --name replace-with-approved-canary \
  --query 'CanaryRuns[0:10].{Status:Status.State,Started:Timeline.Started,Completed:Timeline.Completed,Artifact:ArtifactS3Location}' --output table
Expected interpretation
list-dashboards proves definitions exist, not that their source series are current. describe-canaries proves configuration and current canary state, while run history proves executions. A successful run proves only the scripted path and assertions from that location at that time. It does not prove every user, dependency or Region was healthy.
Practical work
Build a dashboard plan for availability, latency, errors, saturation, deployment, dependency, business result, and cost. Add one canary journey with safe test data, secrets handling, artifacts, timeout, alarm, and cleanup.
Diagnose this topic from its own evidence
| Symptom | Separate these causes | Proof |
|---|---|---|
| blank widget | no datapoints, wrong Region/account/dimensions, permissions or expression error | inspect widget JSON and query source directly |
| dashboard looks healthy during outage | wrong statistic/period, stale refresh, missing user-path signal | absolute UTC range and canary/real request evidence |
| canary times out | DNS, route, SG/NACL, proxy, endpoint, target latency or runtime | per-step logs, VPC path and application trace |
| HTTP 200 but journey is broken | assertion checks only status | assert expected body/state and cleanup synthetic data |
| only one location fails | local runtime/VPC/Regional path vs application | compare identical run IDs/config across locations |
Positive test: a supplied run completes every named step and validates harmless test data. Negative test: the endpoint returns 200 with the wrong body and the assertion fails. Dependency-failure test: DNS or VPC egress prevents reaching an otherwise healthy application; the evidence identifies canary-path failure rather than blaming application code.
Cost and cleanup
Price canary run frequency × locations × steps/runtime, artifact bytes and retention, logs, alarms, custom dashboards/metrics and cross-account or cross-Region telemetry. The canary also generates application requests that may invoke APIs, Lambda, databases and third parties. Cleanup includes stopping/deleting only the owned canary, dashboard, alarm, role/policies, logs, artifact objects/versions, bucket if stack-owned, and synthetic records created in the application.
Knowledge check
- What operational purpose is this lesson solving?
Expected direction: Combine a small service-level dashboard with CloudWatch Synthetics canaries that test a user path, not just infrastructure existence.
- Which scope or ownership boundary must be proved first?
Expected direction: For CloudWatch dashboards and synthetic monitoring, separate account and Region scope, identity, configuration, data or network behavior, failure ownership, evidence retention, and cleanup.
- What evidence is strong enough to accept the result?
Expected direction: Success requires matching Console, command-line, behavior, monitoring, and owner evidence for CloudWatch dashboards and synthetic monitoring. One green status is not enough.
- Which tempting design or shortcut must be rejected?
Expected direction: Avoid real customer transactions, credentials in scripts, screenshots with private data, or dashboards containing every available metric.
- Which cost dimensions and retained resources need an owner?
Expected direction: Canary runs, Lambda runtime, artifacts, logs, custom dashboards, metrics, and retained S3 data can charge.
Lesson acceptance
- The dashboard plan has no more than the widgets needed for availability, latency, errors, saturation, dependencies, changes and cost; every widget has scope and owner.
- One successful and one failed canary run are traced through steps, assertions, artifacts, logs, metrics and application evidence.
- A 200-with-wrong-content negative test fails as designed.
- A network/dependency failure is distinguished from application failure using DNS/VPC/runtime evidence.
- Secrets, test data, runtime lifecycle, artifact retention, Regional placement, price and cleanup all have named owners.