
AWS 242: VPC Flow Logs, Reachability Analyzer, Network Access Analyzer, and network monitoring
Why this lesson matters
AWS241 taught the packet walk. This lesson chooses evidence for that walk:
- VPC Flow Logs: what IP flows were observed at covered interfaces?
- Reachability Analyzer: does current supported configuration model a path between two exact endpoints?
- Network Access Analyzer: which potential paths violate or match a declared access requirement?
- CloudWatch Network Monitoring: where are latency, packet loss, availability, or internet-experience changes occurring?
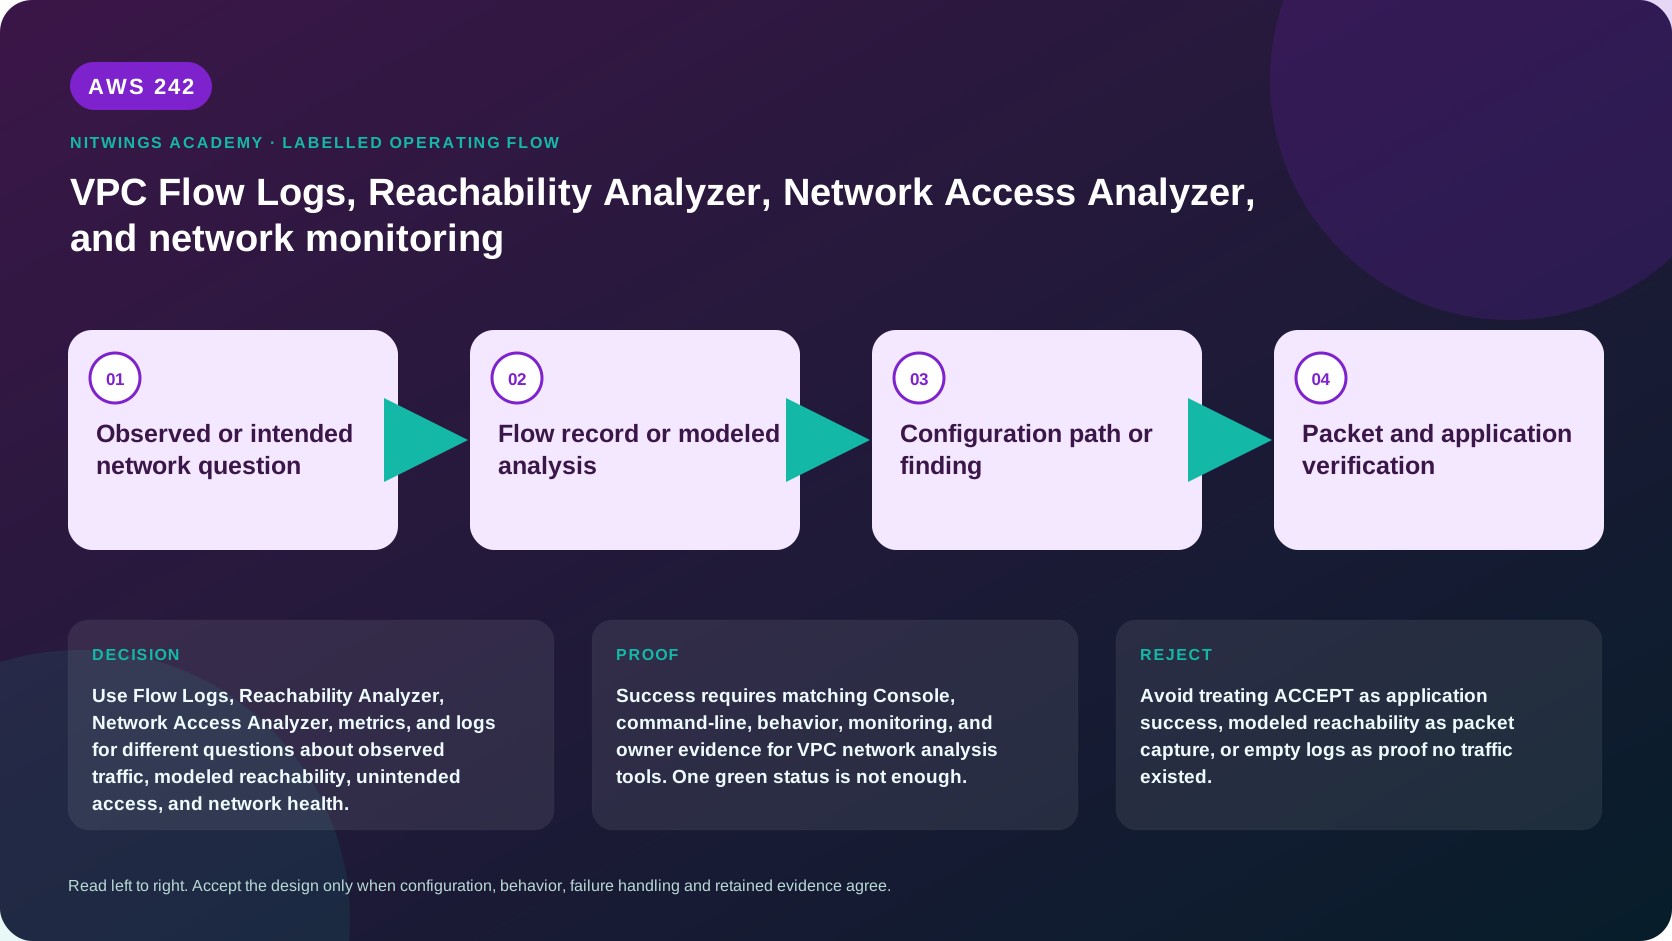
These tools answer different questions. ACCEPT is not application success, “reachable” is not a packet capture, no finding is not universal proof of isolation, and an empty log search is not proof that no traffic occurred.
Outcomes
By the end, you can:
- design flow-log scope, destination, aggregation, format, retention, and queries;
- interpret five-tuples, action, status, packet-level addresses, TCP flags, bytes, and packets;
- explain Flow Logs blind spots, delay, aggregation, and best-effort delivery;
- build and interpret a Reachability Analyzer path without claiming runtime proof;
- design Network Access Analyzer match paths and governed exclusions;
- select Network Flow Monitor, Internet Monitor, or Network Synthetic Monitor;
- correlate modeled configuration, observed flows, performance, and application evidence;
- preserve least privilege, privacy, cost ownership, and no-change proof.
Safety boundary
- This lesson uses supplied data. Do not create flow logs, analyses, monitors, probes, alarms, or destinations.
- Query only approved logs. IPs, ports, account IDs, ENIs, domains, and traffic volumes expose topology and behavior.
- Do not publish full log records or payload-related application logs. VPC Flow Logs contain metadata, not payload.
- Do not weaken a route, SG, NACL, firewall, scope, or exclusion to make a tool “green.”
- Record account, Region, resource coverage, UTC interval, query, and retention source for every conclusion.
History: from records to automated reasoning
- VPC Flow Logs added network-flow metadata to VPC troubleshooting and security analysis without requiring packet-capture appliances.
- Reachability Analyzer later applied automated reasoning to one intended source/destination path through supported VPC configuration.
- In 2021, Network Access Analyzer expanded the question from one path to policy-like searches for unintended access across an account and Region.
- In 2023, Internet Monitor and Network Monitor added internet and hybrid performance views.
- In 2024, CloudWatch consolidated flow, synthetic, and internet monitoring, adding near-real-time TCP performance and attribution for AWS workloads.
The progression is cumulative. Configuration reasoning does not replace observed traffic; observed traffic does not explain every configured possibility; performance telemetry does not prove policy compliance.
Evidence matrix
| Question | Primary evidence | What it cannot prove alone |
|---|---|---|
| Did an IP flow reach a covered ENI? | VPC Flow Logs | Payload, process response, full end-to-end path |
| Should this exact configured path be possible now? | Reachability Analyzer | Historical behavior, transient failure, unsupported component behavior |
| Could a prohibited class of path exist? | Network Access Analyzer | Every unsupported topology or actual exploitation |
| Is an AWS workload path losing packets/adding latency? | Network Flow Monitor | Application correctness |
| Are client networks/locations experiencing internet degradation? | Internet Monitor | Private/hybrid path correctness |
| Is an AWS-to-on-premises path degraded? | Network Synthetic Monitor | Real user traffic or automatic failover |
| Did the application complete its transaction? | App/access logs, trace, synthetic/user test | All alternate potential network paths |
Strong diagnosis intersects at least two evidence families and the application outcome.
VPC Flow Logs: observed metadata
A flow record aggregates an IP flow - normally a five-tuple of source address, destination address, source port, destination port, and protocol - at a specific network interface during a capture window.
Flow logs can be created for a VPC, subnet, or ENI and filter ACCEPT, REJECT, or ALL. Delivery destinations include CloudWatch Logs, S3, and supported delivery pipelines such as Firehose. The source resource selection controls coverage; it is not a retroactive packet recorder.
Time and delivery
Default maximum aggregation is 10 minutes; 1 minute can be selected. Nitro ENIs use one minute or less even if 10 minutes is configured. Capture end time is not delivery time: CloudWatch delivery is typically around five minutes and S3 around ten, but delivery is best effort and can be later.
Therefore an incident query must include:
- the correct UTC interval plus aggregation/delivery allowance;
- the correct ENI(s), including requester-managed LB/NAT/endpoint ENIs;
- the log's creation time and traffic filter;
- the destination, delivery role/policy, and delivery status;
- retention and partition used by the query.
Core fields
| Field | Meaning and trap |
|---|---|
interface-id | ENI that produced this record, not necessarily original endpoint |
srcaddr/dstaddr | Address as represented at this observation layer |
pkt-srcaddr/pkt-dstaddr | Original packet-level address useful across intermediaries |
srcport/dstport/protocol | Transport tuple; protocol is numeric |
packets/bytes | Totals for aggregated record, not per-packet detail |
start/end | Unix timestamps for aggregation, approximate to flow |
action | ACCEPT or REJECT at captured VPC controls |
tcp-flags | Bitmask; supported examples include FIN=1, SYN=2, RST=4, SYN-ACK=18 |
log-status | OK, NODATA, or SKIPDATA |
traffic-path | Egress path classification when applicable |
flow-direction | Ingress or egress relative to interface |
TCP flags may be ORed during aggregation. A short complete flow can show several flags in one record. ACK/PSH are not independently represented, so 0 does not mean no TCP packet existed.
Interpret action and status correctly
ACCEPT: recorded traffic was allowed by the evaluated SG/NACL path at that interface. It does not prove a process listened, TLS succeeded, an HTTP response was correct, or the return path worked.REJECT: traffic was rejected, commonly by SG/NACL, or arrived after a tracked connection closed. Correlate interface, direction, tuple, and rules; the record alone may not name the exact rule.NODATA: no captured network traffic for that interface during that interval.SKIPDATA: records were skipped due to an internal capacity constraint/error. Absence is not evidence of absence.
Flow Logs do not capture packet payload, packet ordering, retransmission details, DNS query names, or process IDs. Some platform traffic is not logged, including examples such as traffic to the Amazon-provided DNS resolver, DHCP, instance metadata, and Windows license activation. Confirm the current limitations before designing a compliance control.
A TCP reasoning example
client -> server: SYN (2), dstport 443, ACCEPT
server -> client: SYN-ACK (18), dstport ephemeral, ACCEPT
Only repeated SYN records and no reverse record can mean destination/path/coverage loss - but first prove the server-side ENI was logged and records were not delayed/skipped. A reverse RST suggests a reachable endpoint rejected/reset the connection. Application and OS evidence must finish the diagnosis.
Safe flow-log queries
CloudWatch Logs Insights example for a known redacted interval and tuple:
fields @timestamp, interfaceId, srcAddr, srcPort, dstAddr, dstPort,
       protocol, action, tcpFlags, packets, bytes, logStatus
| filter interfaceId = "eni-REDACTED"
| filter dstPort = 443
| sort @timestamp asc
| limit 200
S3/Athena can query long-retention partitions and Parquet efficiently when the log was designed that way. Always constrain date/Region/account partitions; broad scans cost more and expose more metadata.
aws ec2 describe-flow-logs + --filter Name=resource-id,Values=vpc-REDACTED + --query 'FlowLogs[].{Id:FlowLogId,Resource:ResourceId,Traffic:TrafficType,Interval:MaxAggregationInterval,DestinationType:LogDestinationType,Destination:LogDestination,Status:FlowLogStatus,Deliver:DeliverLogsStatus,Format:LogFormat}'This describes configuration only. It does not query records.
Reachability Analyzer: one modeled path
Reachability Analyzer builds a static model of supported network configuration. It sends no packets and does not inspect the data plane.
Define:
- source and destination resource/IP;
- protocol and source/destination port where required;
- same Region and supported connected VPC scope;
- optional required or excluded intermediate component;
- the time/configuration version relevant to the incident.
If modeled reachable, it displays a shortest supported path. Other paths can exist; require/exclude an intermediate to analyze alternatives. If not reachable, it identifies a blocking component or combination, but additional blockers may exist behind the first.
It models components such as route tables, prefix lists, SGs, NACLs, internet/NAT gateways, ELB, Network Firewall, peering, TGW, and endpoints within documented constraints. It does not model application process state, DNS selection, packet loss, transient outage, every middlebox feature, traffic mirroring, or every external/on-premises behavior.
aws ec2 describe-network-insights-paths +  --query 'NetworkInsightsPaths[].{PathId:NetworkInsightsPathId,Source:Source,Destination:Destination,Protocol:Protocol,DestinationPort:DestinationPort}'

aws ec2 describe-network-insights-analyses +  --filters Name=network-insights-path-id,Values=nip-REDACTED +  --query 'NetworkInsightsAnalyses[].{AnalysisId:NetworkInsightsAnalysisId,Status:Status,Reachable:NetworkPathFound,Explanations:Explanations}'
Analyses are retained for a limited period (currently documented as automatic deletion after 120 days). Export governed evidence if retention requires it; do not assume the console is permanent.
Network Access Analyzer: access requirements at scale
Network Access Analyzer also uses static automated reasoning but starts with a Network Access Scope:
MatchPaths: potential paths the analysis should identify, often prohibited patterns;ExcludePaths: approved exceptions that should not become findings;- resource statements: IDs, types, groups, and tags;
- packet-header statements: addresses, protocols, and ports;
through: require/exclude a component on a path.
A finding is a potential path that matches at least one match condition and no exclusion. A finding is not proof that traffic occurred. “No findings” means none were produced for that scope, account, Region, current supported configuration, and analysis run - not that the entire organization has no unintended access.
Exclusions are governance objects, not noise suppression. Every exclusion needs business owner, reason, ticket, review/expiry date, and compensating control. A broad exclusion can hide a real violation.
Common scopes ask:
- Can an internet gateway reach a non-web ENI?
- Can development reach production?
- Can a workload egress except through an inspection component?
- Can a database be reached outside an approved source CIDR/port?
Network Access Analyzer evaluates within the account and Region of the run and has documented unsupported resources/configurations. Multi-account assurance requires an orchestrated inventory and separate evidence, not one green result.
aws ec2 describe-network-insights-access-scopes +  --query 'NetworkInsightsAccessScopes[].{ScopeId:NetworkInsightsAccessScopeId,Name:NetworkInsightsAccessScopeArn,Created:CreatedDate}'

aws ec2 describe-network-insights-access-scope-analyses +  --query 'NetworkInsightsAccessScopeAnalyses[].{AnalysisId:NetworkInsightsAccessScopeAnalysisId,ScopeId:NetworkInsightsAccessScopeId,Status:Status,Findings:FindingsFound,Start:StartDate,End:EndDate}'
CloudWatch Network Monitoring: performance questions
CloudWatch Network Monitoring is now a family:
| Capability | Signal | Best question |
|---|---|---|
| Network Flow Monitor | Lightweight agent observes TCP workload flows; packet loss, latency, retransmission/health attribution | Is AWS workload network performance degraded, and where? |
| Internet Monitor | AWS global internet telemetry, city-network/client impact, availability/performance events | Are user locations or ISPs experiencing internet degradation? |
| Network Synthetic Monitor | Managed probes from AWS subnet to on-premises IP/port; RTT/loss and network health indicator | Is a hybrid path degraded even before user traffic reports it? |
Network Flow Monitor is not the same as VPC Flow Logs: one measures TCP performance through an agent/monitor model; the other records aggregated IP-flow metadata at ENIs.
Network Synthetic Monitor probes are active synthetic traffic and are billed per probe. It does not fail over connectivity. The Network Health Indicator helps attribute supported Direct Connect/TGW paths probabilistically; it is evidence, not permission to skip route/device checks.
Internet Monitor baselines traffic and exposes affected geographies/networks and health events. It cannot prove an individual user's DNS, device, TLS, or application state.
Combine metrics with:
- NAT, TGW, VPN, Direct Connect, ELB, Network Firewall, and Resolver metrics/logs;
- CloudWatch anomaly detection/alarms with M-of-N evaluation;
- application SLI such as success rate and latency;
- AWS Health and change/audit timeline.
Correlation workflow
- Write one packet tuple, user impact, UTC window, and expected path.
- Prove telemetry coverage and delivery health before querying.
- Query observed records on source and destination/intermediate ENIs.
- Inspect TCP direction/flags and
ACCEPT/REJECT/statuswithout overclaiming. - Run or review the exact modeled path for the current configuration.
- Compare current model with incident-time changes; static analysis may describe a repaired state.
- Run access-scope analysis for the broader security requirement.
- Check performance telemetry and service metrics.
- Verify DNS, OS listener, TLS, and application transaction.
- State root cause, contradictory evidence, unknowns, correction, rollback, and prevention.
Evidence conflict examples
| Evidence | Correct interpretation |
|---|---|
| RA reachable + no Flow Logs | Configuration supports path; traffic/coverage/delivery still unproved |
Flow ACCEPT + app timeout | VPC filters accepted at that ENI; investigate return path/process/dependency |
| NAA finding + no observed flow | Potential policy violation exists even if unused |
| NAA no findings + public complaint | Scope/support/account/Region may not cover path |
| Synthetic loss + healthy application | Redundancy may mask degradation; investigate before impact grows |
Flow REJECT + RA reachable | Compare time/config version, tuple, ENI, connection state, and unsupported nuance |
Practical evidence-correlation lab
Download:
Complete both investigations. Every claim must name the tool, scope, time, and limitation. Do not repair supplied data.
Cost, retention, and cleanup
- Flow Logs are billed through the applicable vended-log delivery/destination model; ingestion or delivery, storage, archive, Athena scan, Insights query, subscription, and export costs depend on the selected destination and current pricing.
- Reachability Analyzer and Network Access Analyzer analyses are billable. Scope/path objects and retained analyses need lifecycle ownership.
- Network monitoring can charge per monitored resource/flow, monitor/probe, and CloudWatch metrics/logs; verify current Regional pricing.
- High-cardinality custom formats, one-minute aggregation,
ALLtraffic, long retention, and unpartitioned queries increase cost. - This lesson creates no telemetry. Prove before/after inventories for flow logs, insight paths/analyses/scopes, monitors, probes, log groups/buckets, and alarms.
Knowledge check
- Why is
ACCEPTnot application success? - Distinguish
NODATAfromSKIPDATA. - Why can an empty query be misleading?
- What can packet-level addresses reveal that interface addresses hide?
- Why can several TCP flags appear in one record?
- What does Reachability Analyzer model and not model?
- Why might RA show only one of several possible paths?
- Define MatchPaths and ExcludePaths.
- What exactly does “no NAA findings” prove?
- Compare Flow Logs with Network Flow Monitor.
- Choose monitoring for internet-user, AWS workload, and hybrid-path problems.
- How do you resolve RA/Flow Log disagreement?
Lesson acceptance
A passing submission includes coverage/delivery proof; correct record-field interpretation; two correlated cases; exact RA tuple and limitations; NAA requirement, match, governed exclusion, and finding meaning; a monitoring selection; application evidence; root cause/correction/rollback/prevention; dated cost/retention ownership; no sensitive topology; and no-change/production-untouched proof.