
AWS 290: Application discovery evidence and migration business case
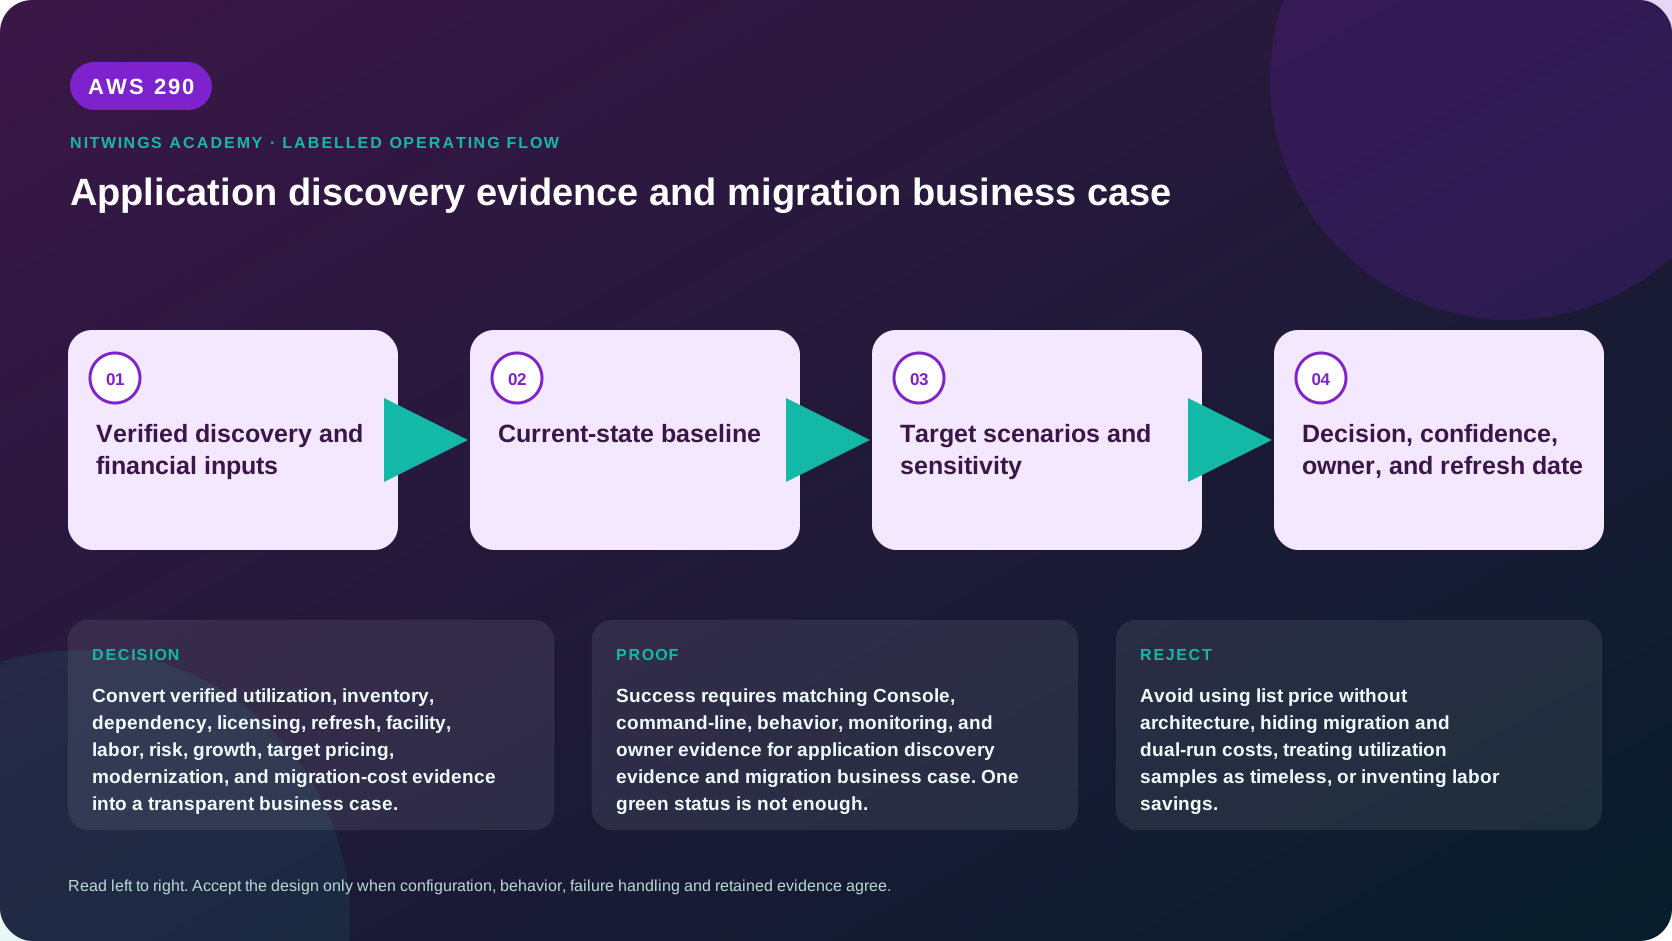
Why this lesson matters
A cloud estimate is not yet a business case. An estimate might say that a group of EC2 instances costs a certain amount. A decision-quality business case must also explain what is being compared, when cash is spent, which existing costs really disappear, what migration and dual-running cost, which assumptions can change the answer, and who owns each claimed benefit.
This lesson turns discovery evidence into a five-year decision model. It builds on AWS281's discovery inventory and AWS289's portfolio governance. It does not repeat those lessons. Here, discovery fields become traceable financial inputs, architecture choices become target costs, migration waves become timed cash flows, and uncertain claims become scenarios.
A responsible architect does not promise a saving because a tool produced one. The architect makes the model reproducible, exposes uncertainty, and states what evidence would reverse the recommendation.
What you will be able to do
By the end, you can:
- distinguish an early directional case from a detailed approval case;
- establish comparable current-state, stay-as-is, and migration scenarios;
- normalize source data and preserve its lineage, age, owner, and confidence;
- calculate one-time, transition, recurring, and decommissioning costs without double-counting;
- translate a target architecture into a complete AWS cost inventory;
- explain TCO, run rate, cash flow, ROI, NPV, and payback in plain language;
- test growth, schedule, utilization, licensing, commitment, and currency assumptions;
- keep resilience, agility, security, and productivity claims measurable;
- diagnose misleading results and recommend proceed, refine, defer, or stop; and
- create a benefit-realization baseline that remains useful after migration.
Before you start
- Use the supplied case. Viewing an organization's inventory, contracts, salaries, invoices, or Cost Explorer data requires explicit authorization because the data is commercially sensitive.
- Do not upload production discovery exports to a personal account or unapproved AI service. Remove credentials, personal data, public IP addresses, hostnames, account IDs, and contract identifiers from shared work.
- Do not use the root user. Cost Management access should be least privilege and separated from permissions to purchase commitments or create resources.
- This is a no-create lesson. Do not create an AWS Transform job, buy a Savings Plan or Reserved Instance, accept a private offer, or modify billing preferences.
- Record currency, tax treatment, accounting period, discount rate, and whether figures include support. A number without these qualifiers is ambiguous.
1. The decision, not the spreadsheet
Write one decision sentence before collecting numbers:
Decide whether to fund the migration of the ten-application portfolio, which treatment to use for each application, and when to execute it, using a five-year comparison against the approved stay-as-is alternative.
Then identify the decision owner, finance reviewer, technology approver, benefit owners, submission date, and next refresh date. A spreadsheet without a decision and owners becomes shelfware.
| Case | Purpose | Appropriate evidence | Correct use |
|---|---|---|---|
| Directional | Decide whether deeper assessment deserves funding | Representative inventory, sampled utilization, benchmarked effort, documented ranges | Compare options and expose large value drivers |
| Detailed | Authorize a phase, budget, and accountable outcomes | Validated dependencies, contracts, designs, quotes, wave plan, named owners | Establish the approved baseline and control changes |
Do not give a directional estimate false precision. USD 4.27 million is not more trustworthy than USD 4.1-4.5 million when discovery coverage is incomplete.
2. Build an evidence register
Every input must lead back to evidence. Use these columns:
| Field | Meaning |
|---|---|
| Evidence ID | Stable identifier referenced by workbook cells |
| Claim | The fact or assumption, including units |
| Scope | Application, server, contract, facility, or portfolio |
| Source and collection method | Invoice, CMDB, monitoring export, interview, quote, or AWS tool |
| Observation window | Exact start and end time, not “recent” |
| Source owner and reviewer | People who can explain and approve it |
| Confidence | High, medium, or low, with a reason |
| Treatment | Actual, forecast, proxy, benchmark, or excluded |
| Refresh trigger | Age, design change, contract renewal, or wave gate |
Reconcile four identities before costing: application, business service, technical component, and financial cost center. Ten servers are not necessarily ten applications, and one shared database must not be charged in full to every consumer.
Normalize before comparing
Convert inputs to a common currency and period. State the foreign-exchange date or rate. Separate tax-inclusive from tax-exclusive figures. Convert annual contracts and monthly consumption consistently. Use a representative utilization window that includes month-end, quarter-end, batch, seasonal, and recovery events where applicable.
For compute, record CPU, memory, network, disk throughput, IOPS, latency, uptime schedule, architecture, operating system, and growth. Average CPU alone cannot size a workload. A low average can hide a short business-critical peak, and memory may be the limiting resource.
For missing data, never enter zero unless the cost is proven to be zero. Use unknown, assign a range, and create a validation action.
3. Establish the stay-as-is baseline
The correct comparison is not “today's bill versus AWS list price.” It is the cost and risk of continuing over the same time horizon. Include the refresh the organization would otherwise need.
Build the baseline from these cost pools:
- server, storage, network, backup, and security hardware;
- data-center or colocation space, power, cooling, and cross-connects;
- hypervisor, operating system, database, monitoring, backup, and security licenses;
- vendor maintenance and support;
- carrier circuits and internet connectivity;
- outsourced operations and directly attributable internal labor;
- disaster recovery facilities, tests, media, and replication;
- forecast capacity expansion, refresh purchases, and disposal; and
- material outage or compliance exposure, shown separately from certain cash cost.
Avoid three accounting traps. First, depreciation is an accounting expense while a future refresh is cash flow; do not count both as though they were separate purchases. Second, a sunk purchase price does not disappear when evaluating a future decision, although a remaining write-off or termination charge can matter. Third, allocated shared cost disappears only if the underlying contract, asset, facility, or role is actually removed.
Mark each cost as avoidable, partly avoidable, unavoidable, or timing shift. Attach an owner and earliest removal date. This creates a credible source-decommission plan instead of an imaginary saving.
4. Translate architecture into the AWS run rate
Price a defined architecture, not a collection of instance names. For every application, state the target Region, accounts, environments, Availability Zones, recovery Region, RTO, RPO, throughput, retention, and growth.
Inspect all applicable categories:
- EC2 runtime, Auto Scaling headroom, operating-system or commercial software charges, and dedicated tenancy if required;
- EBS capacity, volume performance, snapshots, archive, and cross-Region copies;
- load balancers, processed bytes, public IPv4 addresses, Route 53, CloudFront, WAF, and Shield choices;
- NAT gateway hours and bytes, Transit Gateway, interface endpoints, VPN, Direct Connect, internet egress, inter-AZ and inter-Region transfer;
- S3 storage classes, requests, retrieval, lifecycle transitions, replication, and data transfer;
- RDS or Aurora instances or capacity, Multi-AZ, replicas, storage, I/O, backups, extended support, and data transfer;
- containers, serverless requests and duration, queues, streams, caches, search, and API processing;
- KMS requests and keys, Secrets Manager secrets and API calls, certificates where chargeable, and identity tooling;
- CloudWatch metrics, logs, ingestion, queries, alarms, traces, dashboards, and retention;
- GuardDuty, Security Hub, Config, Inspector, backup, disaster-recovery tests, and AWS Support;
- sandbox, development, test, performance, pre-production, and temporary migration environments; and
- people, managed services, FinOps, training, and operational process change.
For each line, show quantity x unit rate x active period. Link the quantity to architecture evidence and date the rate. Use the AWS Pricing Calculator or an assessment as a starting artifact, then review omissions. Prices, features, and taxes change, so this course deliberately does not hard-code a current price.
Right-size without creating fragility
Use representative percentiles, observed peaks, seasonality, growth, failover behavior, and service limits. Preserve headroom justified by recovery and deployment patterns. An N+1 service after an Availability Zone loss cannot be priced as though every instance remains available.
Create at least these scenarios:
- On-Demand, representing flexibility and an upper planning baseline.
- Expected optimized use, including scheduling, elasticity, storage lifecycle, and verified right-sizing.
- Eligible commitment coverage after stable demand is demonstrated.
Do not apply a Savings Plan or Reserved Instance discount to every hour. State term, payment option, eligible spend, proposed coverage, utilization, flexibility, and stranded-commitment risk. Spot is suitable only for interruption-tolerant work with a tested fallback. A purchase recommendation based on history is not a forecast of future architecture.
5. Model migration and transition costs
One-time investment commonly includes assessment, detailed design, landing-zone work, connectivity, security integration, tooling, data transfer, remediation, refactoring, testing, vendor services, training, program governance, change management, and contingency.
Transition cost deserves its own section:
- parallel source and AWS operation;
- replication, staging, test, and cutover infrastructure;
- increased network capacity and data-movement appliances or services;
- temporary licenses and support;
- rollback reserve and hypercare; and
- productivity loss while teams learn new processes.
Time these amounts by migration wave. AWS run rate ramps up as applications cut over. Source cost ramps down only after validation, retention, contract notice, and decommissioning. Include termination fees, asset write-offs, data destruction, and facility closure. A delayed decommissioning month can materially change payback.
Keep contingency visible. Do not silently inflate every line and then add contingency again.
6. Construct the cash-flow model
Create separate monthly columns for the first 24 months and annual columns thereafter. For each period calculate:
stay-as-is cash flow = operations + contracts + refresh + growth + risk treatment
migration cash flow  = program + migration + transition + AWS run rate + retained source cost
net benefit          = stay-as-is cash flow - migration cash flow + approved benefits
cumulative benefit   = prior cumulative benefit + current net benefit
Key measures answer different questions:
- TCO is the total cost over the selected period. It is not a timing-aware return measure.
- Final run rate compares steady recurring cost after transition with the comparable source run rate.
- Payback is the first period when cumulative net benefit becomes nonnegative. If it never does within the model, state “no payback in horizon.”
- ROI can be
(total benefits - total investment) / total investment, but finance must approve what counts as benefit and investment. - NPV discounts future net cash flows:
NPV = sum(CFt / (1 + r)^t), whereris the approved periodic discount rate.
Never mix nominal cash flows, which include inflation, with a real discount rate, which excludes it. State whether inflation, salary growth, AWS price changes, and foreign exchange are modeled. Ask finance to validate the convention.
Example: an undiscounted 100,000 benefit in year 3 is not worth 100,000 today. At an 8 percent annual discount rate, its present value is approximately 100,000 / 1.08^3, or 79,383. This is a teaching calculation, not an organizational rate recommendation.
7. Measure value without inventing it
Resilience, agility, security, sustainability, and productivity can matter more than infrastructure savings, but a percentage copied from a benchmark is not automatically a cash benefit.
| Benefit | Baseline | Mechanism | Metric and target | Financial treatment | Owner | Measurement date |
|---|---|---|---|---|---|---|
| Faster releases | Current lead time | Automated platform and deployment | Median lead time | Nonfinancial until revenue/cost link is approved | Product owner | 90 days after cutover |
| Reduced outage impact | Incident frequency and duration | Multi-AZ design and tested recovery | Availability, MTTR, failed recovery tests | Risk-adjusted or qualitative | Service owner | Quarterly |
| Operations capacity | Hours by activity | Managed service removes named tasks | Hours redirected and work delivered | Cash only if budget actually changes | Operations leader | Monthly |
Do not count the same labor hours as both headcount saving and capacity redeployed. Do not monetize avoided outage at maximum revenue unless probability, impact, and causal improvement are defensible. Keep qualitative benefits visible even when finance excludes them from NPV.
8. Scenarios, sensitivity, and break-even
A single answer hides risk. Build low, base, and high cases. Change one driver at a time for sensitivity, then combine plausible values into scenarios.
Test at minimum:
- portfolio and transaction growth;
- utilization and right-sizing confidence;
- migration effort and schedule delay;
- parallel-running and source-decommission duration;
- license mobility and audit outcome;
- data transfer, logging, backup, and security volume;
- commitment coverage and utilization;
- labor or partner rates;
- inflation and foreign exchange; and
- benefit start date and realization percentage.
Rank variables by their effect on NPV or payback. Investigate the largest drivers first. Calculate a break-even value where useful: for example, the maximum migration investment or delay at which NPV becomes zero. This tells the governance team what must be controlled.
9. Safe inspection of existing AWS evidence
Only if authorized, Cost Explorer can provide historical AWS evidence. It does not reveal on-premises costs and it does not make the business decision.
export AWS_DEFAULT_REGION="us-east-1"
aws sts get-caller-identity --query Arn --output text

aws ce get-cost-and-usage \
  --time-period Start=2026-08-01,End=2026-09-01 \
  --granularity MONTHLY \
  --metrics UnblendedCost AmortizedCost NetAmortizedCost \
  --group-by Type=DIMENSION,Key=SERVICE \
  --region us-east-1
The end date is exclusive. Replace dates with an approved closed period. Unblended cost shows usage at charged rates; amortized views distribute upfront and recurring commitment fees across the covered period; net views can reflect discounts. Finance must choose the view. Tags and cost categories need governance, and shared charges need a documented allocation method.
AWS Cost Explorer forecasts are predictions based on past AWS usage, not guarantees. Rightsizing recommendations also have observation-window and metric assumptions. Review those assumptions before importing a recommendation into the case.
AWS Transform migration assessments can ingest supported inventory, show data-quality warnings, recommend right-sized EC2 and EBS configurations, model services such as RDS and FSx where applicable, and compare assumptions such as Region, pricing model, instance exclusions, storage, and SQL Server licensing. Treat the output as a scenario generated from supplied data. Validate scope, dependencies, unsupported components, licensing, target architecture, network, support, migration effort, and decommission timing independently.
10. Guided five-year portfolio workshop
Use ten applications: customer portal, order API, batch scheduler, reporting, file exchange, identity bridge, ERP integration, document archive, test platform, and legacy licensing service. The supplied portfolio contains 46 servers, 80 TB allocated storage, 52 TB used, two sites, and a hardware refresh due in year 2.
Use these controlled teaching assumptions, clearly labeled as assumptions rather than market facts:
- current recurring avoidable cost: USD 720,000 per year;
- current unavoidable shared cost: USD 180,000 per year;
- stay-as-is refresh: USD 900,000 in year 2;
- base target AWS and operations run rate after full migration: USD 610,000 per year;
- one-time migration investment: USD 1,050,000;
- waves complete at months 6, 10, 14, and 18;
- each source application's avoidable cost ends three months after its cutover;
- contingency: 15 percent of uncertain migration work, shown separately;
- discount rate: 8 percent annually for training only; and
- no monetized agility or resilience benefit in the base financial case.
Complete the following:
- Create the decision statement, scope, owners, currency, horizon, and evidence register.
- Allocate source cost without counting shared cost ten times. Explain what remains after migration.
- Add year-2 refresh to stay-as-is. Explain why historical purchase price is not added again.
- Design a plausible target for every application and itemize all AWS cost categories.
- Build monthly migration, AWS ramp-up, source ramp-down, and decommission cash flows.
- Calculate five-year TCO, final run rate, cumulative benefit, payback, ROI, and NPV.
- Build low, base, and high scenarios. In the high-cost case, delay every wave by three months, increase migration effort by 25 percent, and extend source retention by six months.
- Test commitment coverage at 0, 50, and 75 percent of eligible stable compute. Do not assume 100 percent utilization.
- Find the three variables with the largest NPV effect and define a validation action for each.
- Create a benefit register without assigning cash value to an unapproved claim.
- Recommend proceed, refine, defer, or stop. State the evidence that would change your recommendation.
- Present a one-page executive summary and a technical appendix that allows another analyst to reproduce every total.
Your workbook passes only if changing one source input updates dependent totals and if a reviewer can trace every material number to evidence or a named assumption.
11. Diagnose misleading business cases
| Symptom | Likely cause | Corrective action |
|---|---|---|
| Very large saving with no target diagram | List-price comparison omitted required services | Price the complete architecture and quality-of-service requirements |
| Immediate payback | Migration, dual run, or source retirement timing is absent | Build period cash flows and explicit ramp curves |
| Every discovered VM maps to one EC2 instance | Server inventory was treated as architecture | Group applications, dependencies, schedules, and modernization choices |
| Average CPU produces tiny instances | Peaks, memory, I/O, failover, or growth were ignored | Use representative multi-metric evidence and test headroom |
| Commitments create guaranteed savings | Coverage, utilization, term, and changing demand were ignored | Model On-Demand first and show commitment risk separately |
| Labor saving has no budget owner | Productivity was confused with cash removal | Name the task, capacity, owner, and financial treatment |
| Source cost falls to zero at cutover | Contracts and decommission gates were omitted | Link removal to validation, notice periods, disposal, and facility closure |
| NPV changes dramatically with one assumption | Case is concentrated and fragile | Validate the driver, show ranges, and use decision gates |
| Tool output is accepted unchanged | Input quality or unsupported scope was not reviewed | Reconcile inventory, warnings, exclusions, and architecture |
12. Approval gates and benefit realization
At directional approval, require scope coverage, explicit exclusions, architecture scenarios, low/base/high results, and funding for deeper discovery. At detailed approval, require signed input owners, validated licenses and contracts, target designs, migration estimates from delivery teams, wave timing, security and recovery requirements, finance-reviewed calculations, and named benefit owners.
After each wave, compare forecast with actual:
- migration spend and completion date;
- AWS cost by account, tag, cost category, and service;
- commitment coverage and utilization;
- source systems actually decommissioned and invoices actually removed;
- performance, availability, recovery, security, and delivery outcomes; and
- benefits accepted, delayed, rejected, or double-counted.
Reforecast the remaining program. Do not rewrite the original baseline to hide variance. Preserve an approved version, record changes, and explain their causes.
Knowledge check
- Why is an AWS estimate not a complete business case?
It omits some combination of the alternative, migration, timing, source retirement, benefits, uncertainty, and ownership.
- Why can an old server with low book value still make stay-as-is expensive?
Continued operation can require support, licenses, facilities, labor, risk treatment, growth, and a future refresh.
- When does an allocated data-center cost become a saving?
When the underlying cash commitment or resource can actually be removed, not merely reassigned.
- Why model On-Demand before commitments?
It exposes the architecture run rate and avoids assuming stable eligible usage before it has been proved.
- What is the difference between TCO and NPV?
TCO totals costs over a period; NPV also accounts for when net cash flows occur using an approved discount rate.
- What does payback show?
The first period in which cumulative net benefits recover the investment under the stated assumptions.
- Why are productivity hours not automatically cash savings?
Capacity creates cash only when an approved budget changes; it can instead be redeployed to other valuable work.
- What is the strongest response to missing data?
Mark it unknown, use a transparent range, assess sensitivity, and assign a validation action.
Lesson acceptance
You are ready to continue when your submission includes:
- a decision statement, complete scope, evidence register, and data-quality assessment;
- comparable stay-as-is and migration scenarios over the same five-year horizon;
- traceable current, migration, transition, target, decommission, and retained costs;
- monthly cash flow through migration and annual cash flow thereafter;
- correctly explained TCO, run rate, payback, ROI, and NPV;
- low, base, and high scenarios plus ranked sensitivity drivers;
- a benefit register with baselines and accountable owners;
- explicit exclusions, risks, commitment assumptions, and break-even conditions;
- a recommendation and approval gates; and
- a post-wave actual-versus-forecast and benefit-realization plan.