
AWS 315: FinOps, chargeback and showback
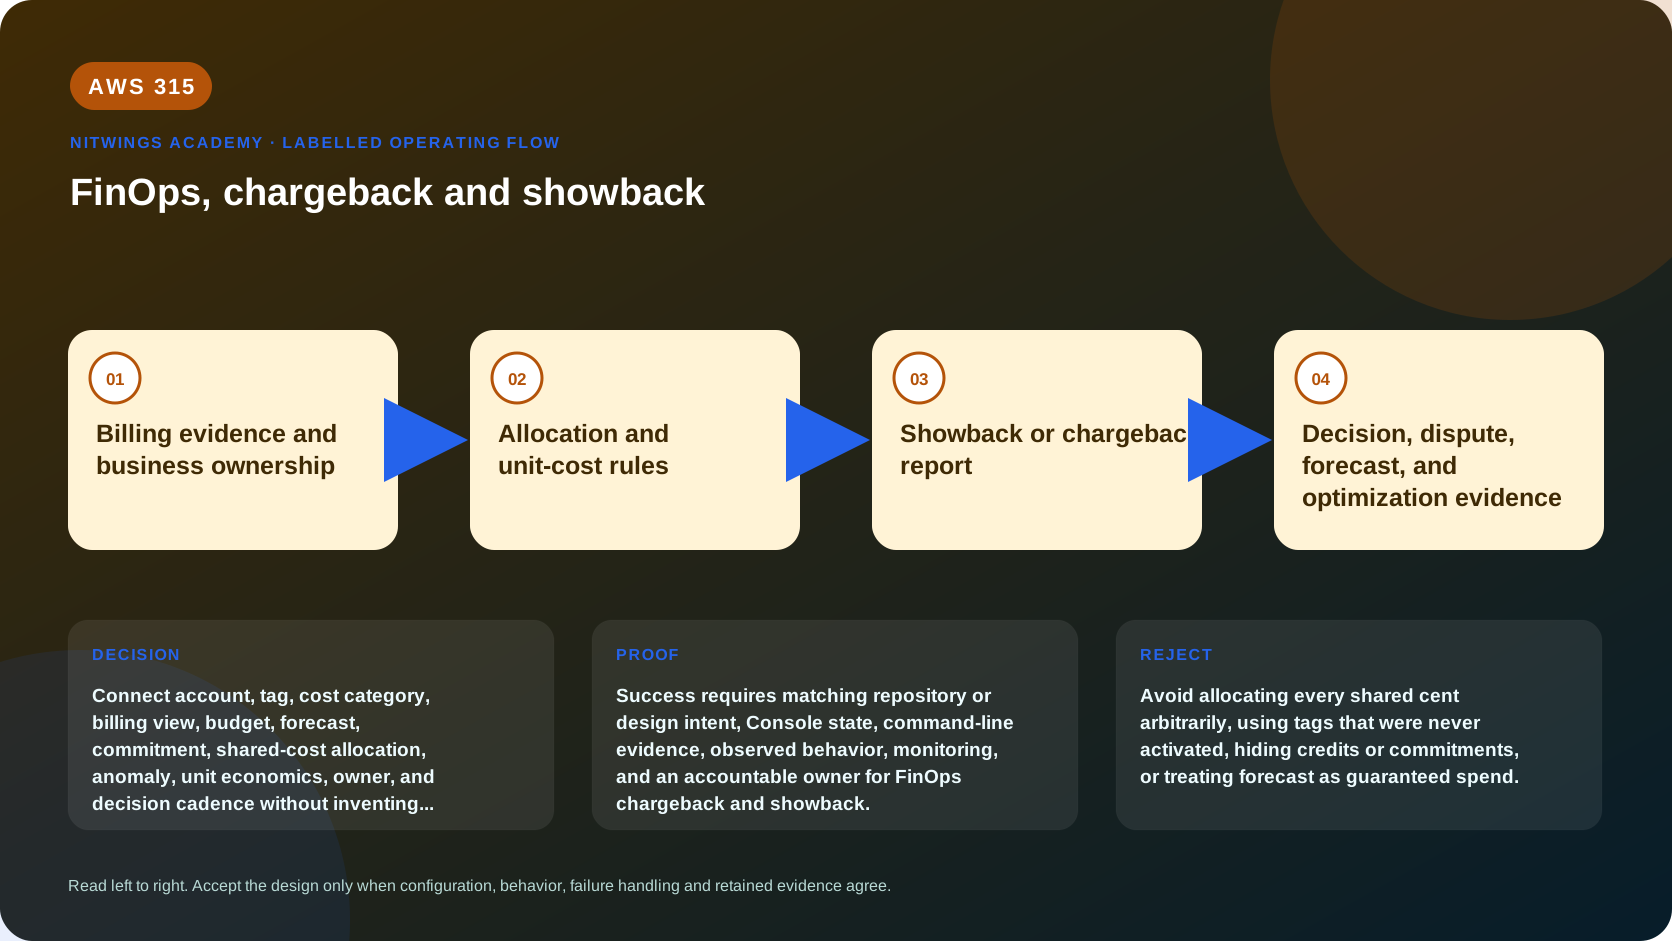
Why this lesson matters
FinOps is an operating practice that brings engineering, finance, product, procurement, and leadership together to maximize business value from technology. It is not a monthly list of expensive resources and it is not a team that unilaterally cuts cost.
Showback reports cost and usage to responsible teams while expense remains in a central or existing budget. Chargeback transfers allocated expense into official accounting budgets or profit-and-loss ownership. Showback is foundational; chargeback is optional and depends on accounting policy. A complicated chargeback process is not automatically more mature.
Allocation creates accountability only when data is complete, rules are transparent, shared costs are handled consistently, and teams can act. False precision destroys trust. A cost split based on a weak proxy should be labeled, reviewed, and improved rather than presented as exact.
What you will be able to do
By the end, you can:
- explain FinOps personas, scopes, phases, capabilities, and decision cadence;
- distinguish billing truth, allocation, showback, chargeback, budget, forecast, and unit economics;
- create account, tag, cost-category, and external-metadata allocation hierarchy;
- allocate shared services with causal drivers and documented confidence;
- handle commitments, credits, refunds, support, Marketplace, tax, and unallocated cost;
- build persona-specific reports and variance narratives;
- define budgets, forecasts, anomalies, and action workflows;
- calculate technical and business unit metrics;
- connect approved chargeback to finance close without changing invoice truth;
- measure allocation coverage, action completion, savings realization, and value; and
- produce a 20-account P19 FinOps operating model.
Before you start
- Complete AWS314. CUR 2.0 and reconciliation are the cost-data foundation.
- Use synthetic values. Cost, discounts, contracts, account IDs, budgets, revenue, headcount, and margins are confidential.
- Do not change organization accounts, tags, budgets, commitments, cost categories, Billing Conductor, or financial systems in this T0 lesson.
- A recommendation is not realized savings until usage and cost actually change without unacceptable business impact.
1. Build the operating model
billing + usage + business demand
  -> ingest/reconcile
  -> allocate
  -> report/showback
  -> decide and act
  -> measure cost, usage, value, and risk
  -> improve allocation/forecast/architecture
Key personas:
| Persona | Decisions |
|---|---|
| Engineering/operations | Architecture, usage, scaling, lifecycle, efficiency |
| Product/business | Demand, features, service level, price, margin, value |
| Finance/accounting | Budget, forecast, close, capitalization, chargeback |
| Procurement | Rates, commitments, Marketplace, licenses, renewals |
| Leadership | Priorities, risk appetite, investment, accountability |
| FinOps practitioner | Common data, terminology, facilitation, analysis, controls |
Everyone owns technology usage in their sphere. FinOps centralizes evidence and coordination, not every decision.
2. Define scopes and terminology
A FinOps scope can be organization, business unit, product, application, environment, or another decision boundary. Keep names consistent across account vending, tags, CMDB, CUR, observability, budgets, and general ledger.
Define:
- actual cost: recognized amount under the selected metric and close;
- budget: approved spending boundary or plan;
- forecast: current estimate based on demand and rates;
- variance: actual/forecast difference from baseline with cause;
- allocation: mapping direct/shared spend to accountable scopes;
- showback: visibility without official accounting transfer;
- chargeback: formal expense transfer to finance budgets;
- optimization opportunity: modeled potential;
- realized value: verified outcome after action, net of costs/risks.
3. Build an allocation hierarchy
Allocate in order:
- direct account ownership;
- valid resource tag or cost category;
- authoritative CMDB/deployment metadata;
- resource/usage metric tied to consumer;
- approved shared-cost driver;
- central cost by policy; and
- explicit unallocated bucket.
Never overwrite raw billing data. Store allocation rule/version/effective date, source fields, target, amount, confidence, and reason as a separate governed transformation.
Tag policy needs required keys, value dictionary, case/format, owner, enforcement point, exception expiry, coverage target, and remediation. Account-level isolation is often more reliable than tags for major products/environments. Tags add resource detail but do not cover every cost.
Cost Categories can express hierarchical rules over accounts, tags, services, and other dimensions. Rule order and effective dates matter. Test representative line items and preserve versioned outputs.
4. Allocate shared cost without inventing accuracy
Examples:
| Shared cost | Better driver | Weak shortcut |
|---|---|---|
| Transit/network hub | bytes, connections, or known path usage | equal split regardless of use |
| EKS platform | requested/used resources plus shared baseline | pod count only |
| Observability | ingested bytes, retained GB, query use | total application spend |
| Support plan | agreed proportional spend or support demand | arbitrary team percentage |
| Security platform | protected resources/events plus central policy | hide all centrally |
| Data platform | storage, compute, queries, pipelines | row count without workload cost |
A driver must be causal enough for decisions, stable, available at close, understandable, and not more expensive to measure than the decision value. Publish shared-cost amount, method, exclusions, confidence, and sensitivity.
Commitment discounts create two questions: who receives the discount benefit and who owns unused commitment? Options include sharing across eligible consumers, assigning to purchaser, or centralizing. Finance, procurement, and engineering must approve one consistent policy. Do not reprice history opportunistically.
5. Design showback reports
Every report should answer:
- what changed and why;
- who owns it;
- whether usage, rate, allocation, or accounting caused the change;
- what business volume/value changed;
- what action is possible;
- confidence and known gaps; and
- decision/owner/due date.
Engineering needs resource/usage/unit signals. Product needs product cost, customer demand, and margin. Finance needs close, budget, forecast, account/cost-center mapping, and adjustments. Leadership needs trends, value, risk, commitments, and major decisions.
Avoid one dashboard for all personas. Keep common reconciled data and definitions, then publish role-specific views.
6. Implement chargeback only when justified
Chargeback requires:
- reconciled final cost source;
- approved account/tag/allocation rules;
- finance cost-center and chart-of-account mapping;
- currency/tax/credit/commitment policy;
- shared-cost policy;
- close calendar and adjustment process;
- dispute and correction workflow;
- controlled chargeback file/interface;
- finance acceptance and audit evidence; and
- versioning so reruns are reproducible.
Do not charge teams from mutable current-month estimates. Use showback for timely behavior and final approved data for accounting. Late refunds or corrections need a documented future-period adjustment or reopened close.
7. Budget, forecast, anomaly, and action
Budgets are guardrails, not forecasts. Forecasts change with demand, seasonality, product plans, rates, commitments, migrations, and known events. Track assumptions and confidence ranges.
Anomaly detection finds unusual patterns but does not know whether a launch was authorized. Route alerts to an owner with account/service/resource/dimension evidence, expected baseline, estimated impact, and runbook. Suppression must expire.
Action workflow:
signal -> triage -> owner accepts/rejects -> change approval
 -> implement -> verify workload health -> verify cost after billing lag
 -> record realized value or rollback
Deduplicate recommendations from Cost Optimization Hub, Compute Optimizer, Trusted Advisor, vendor tools, and human reviews. Separate gross annualized opportunity from achievable, approved, and realized value.
8. Use unit economics
Resource efficiency metrics include cost per GB, request, token, build minute, desktop hour, or stream event. Business unit metrics include cost per order, active customer, shipment, case resolved, or revenue unit.
unit cost = fully defined allocated cost / validated business unitsThe numerator needs scope, metric, shared-cost policy, and period. The denominator needs authoritative event definition, late/cancelled handling, and same period. A lower unit cost can hide worse quality, so pair it with availability, latency, errors, satisfaction, risk, and sustainability where relevant.
Rising total cost can be healthy if units and value rise faster. Falling cost can be harmful if it comes from failed demand or reduced service.
9. Governance cadence
- daily: severe anomalies and runaway spend;
- weekly: engineering action queue and launch/migration changes;
- monthly: close, showback, forecast, allocation coverage, unit trends;
- quarterly: commitments, architecture, shared-cost policy, product margin;
- annually/renewal: contracts, licenses, Marketplace, account model, targets.
Every meeting needs inputs, decisions, owners, due dates, and closure. A dashboard without action is not a FinOps practice.
10. Read-only evidence
aws ce get-cost-and-usage \
  --time-period Start=2026-08-01,End=2026-09-01 \
  --granularity MONTHLY --metrics UnblendedCost \
  --group-by Type=DIMENSION,Key=LINKED_ACCOUNT
aws ce list-cost-category-definitions --output table
aws budgets describe-budgets --account-id REDACTED --output table
aws cost-optimization-hub list-recommendations --output table
Cost Explorer aggregates may differ from final CUR 2.0 views. Redact all output and state the metric, filter, period, currency, and refresh time.
11. Diagnose from evidence
| Symptom | Evidence | Response |
|---|---|---|
| Allocated total differs from bill | raw total, rule joins, duplicates, currency, unallocated | Reconcile before reporting; allocation must conserve cost. |
| Tag coverage falls | eligible population, activation, policy violations, new services | Expose unallocated cost and fix provisioning controls. |
| Teams dispute shared cost | driver, source metric, sensitivity, policy approval | Re-evaluate causality and publish transparent versioned rule. |
| Forecast misses every launch | demand calendar, owner inputs, model assumptions | Integrate product plans and confidence ranges. |
| Savings dashboard grows but bill does not fall | duplicate/stale recommendations, baseline, implementation, demand | Measure realized usage/cost net of business change. |
| Unit cost improves while customers fail | denominator, quality guardrails, dropped demand | Pair economics with outcomes and reverse harmful action. |
| Chargeback changes after close | source version, late adjustment, rerun, finance controls | Freeze close and process governed adjustment. |
12. P19 operating-model workshop
Design FinOps for 20 accounts, five products, a shared network/security/data platform, one Savings Plan portfolio, Marketplace software, and 65 percent tag coverage.
Submit:
- persona/RACI and decision scopes;
- terminology/data dictionary;
- CUR 2.0-to-allocation lineage;
- account/tag/cost-category hierarchy;
- unallocated and exception policy;
- six shared-cost drivers with sensitivity;
- commitment/credit/refund/tax policy;
- engineering/product/finance/leadership showback views;
- optional chargeback close/interface design;
- budget/forecast/anomaly workflows;
- opportunity-to-realized-value ledger;
- three resource and three business unit metrics;
- cadence and decision log;
- seven failure diagnoses;
- maturity roadmap with measurable gates; and
- governance acceptance record.
Cost and cleanup
FinOps itself costs data storage/query, BI, vendor tools, tagging/CMDB integration, engineering remediation, human review, finance close, and governance time. Measure practice cost against decisions and realized value, not only savings.
T0 creates nothing. Preserve redacted definitions and calculations. Any later pilot must have a controlled dataset, expiry, consumer list, deletion policy, and proof that dashboards/alerts/scheduled queries are removed when replaced.
Knowledge check
- Showback versus chargeback? Visibility versus formal accounting transfer.
- Is chargeback always more mature? No; accounting policy and decision value determine need.
- Why keep unallocated visible? Hiding it creates false completeness and removes remediation incentive.
- Best shared-cost driver? A causal, stable, understandable, available metric proportionate to decision value.
- Opportunity versus realized value? Modeled potential versus verified outcome after implementation and health checks.
- Why pair unit cost with quality? Cost can fall because service or demand failed.
- Why not charge current estimates? Billing data and allocation can change before close.
- What makes FinOps effective? Trusted data, shared decisions, accountable action, measured value, and continuous improvement.
Lesson acceptance
Pass when all cost is conserved into direct, shared, central, or visible unallocated categories; every rule has evidence/version/owner; reports drive named decisions; and chargeback, if used, reconciles to finance. Fail if tags are treated as complete truth, shared cost is hidden, savings are claimed before realization, unit metrics omit outcomes, or mutable estimates enter official accounting.