
AWS 394: CloudWatch Agent, dashboards, alarms, and Logs Insights as code
Why this lesson matters
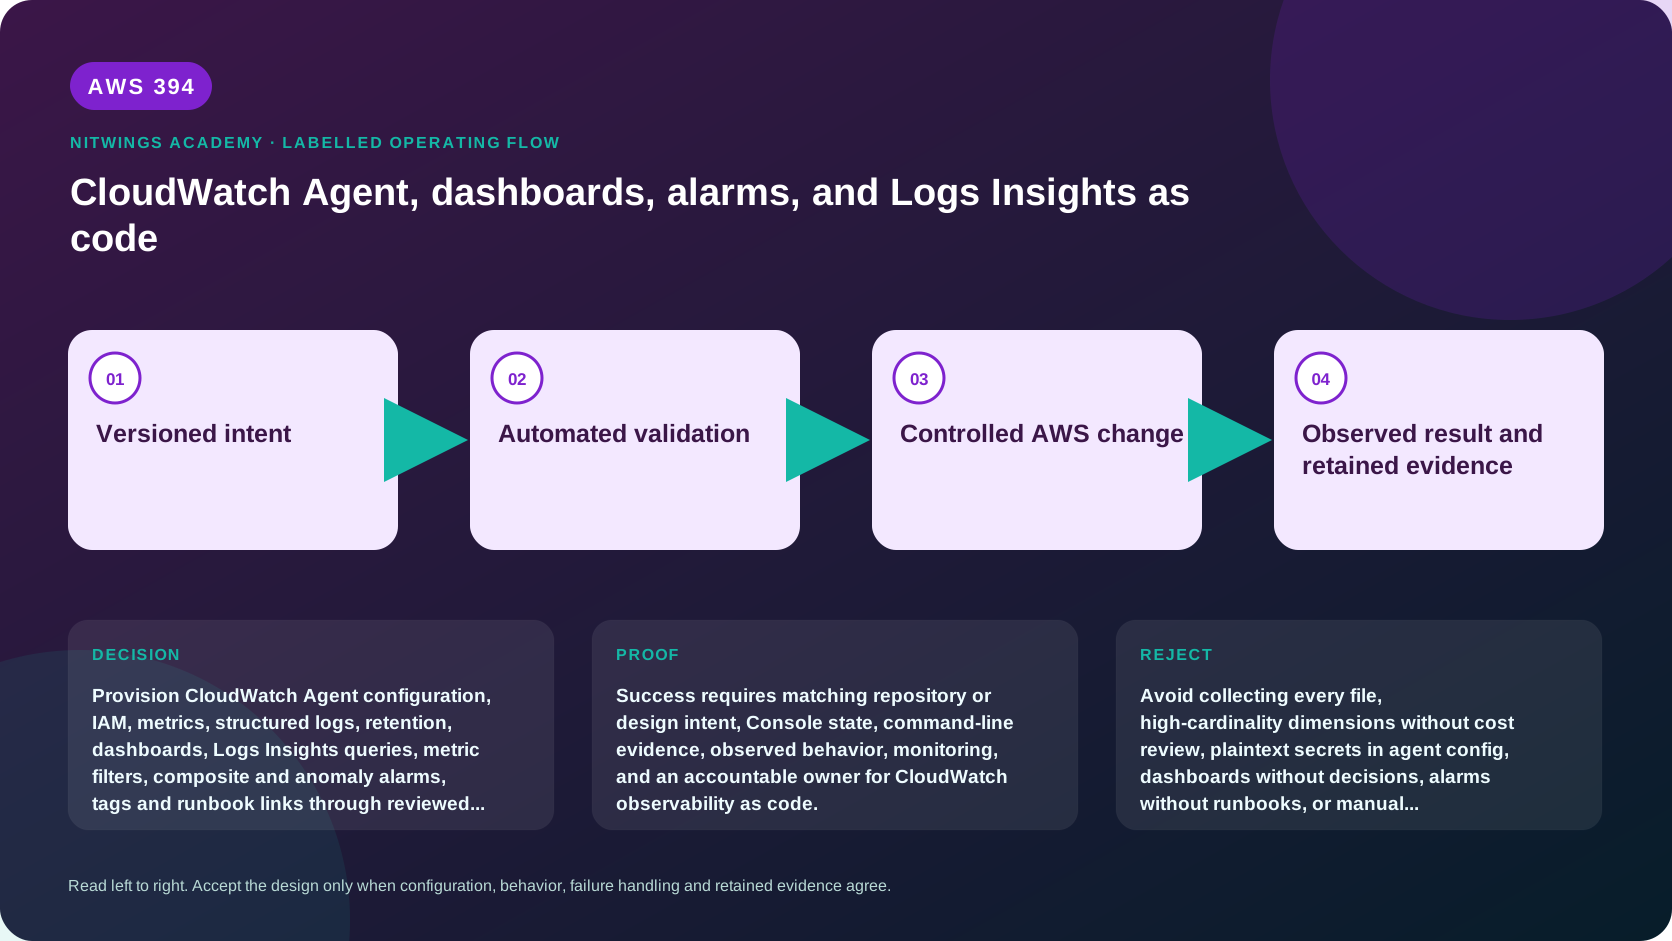
CloudWatch observability as code makes collection, retention, dashboards, queries, alarms, routing and runbooks reviewable and repeatable. It can also create runaway cardinality/cost, duplicate ingestion, noisy pages, leaked secrets and false confidence unless every signal has purpose and ownership.
Collection architecture
The unified CloudWatch Agent can collect host metrics, process metrics, logs and traces in supported setups. Distribute versioned configuration through IaC/Systems Manager or an approved mechanism. The instance/task identity needs only required PutMetricData, log stream/event, X-Ray and configuration-read permissions; deployment identity is separate.
| Layer | Design decisions |
|---|---|
| Agent | version, config source/hash, restart/rollback, self-health |
| Metrics | namespace, dimensions, interval, aggregation/drop-original rules |
| Processes | procstat selector, expected count/state and platform support |
| Logs | exact files/journals, multiline/timezone, group/stream, retention/class |
| Traces | receiver/exporter, sampling, propagation and service identity |
| Security | role, encryption, redaction, access and data residency |
Avoid dimensions such as request/user/container IDs that create a metric per value. High-resolution intervals increase ingestion and alarm evaluation cost. Aggregation can reduce cardinality, but dropping original metrics removes per-host diagnosis. Decide from the operating question.
For Linux, test file permissions, rotation/inode behavior, journald selection, multiline parsing, timestamp fallback, disk buffering and agent restart. Never collect secret files, command histories, tokens or full payloads. Set log-group retention and KMS/access policy through IaC before ingestion where possible.
Dashboards, queries, and alarms
An operator dashboard should begin with user SLO/traffic/errors/latency, then release/config markers, saturation/capacity, dependencies, queues/data freshness, and drill-down links. Include account/Region/environment, time/UTC, owners and runbooks. A wall of green host metrics is not a service dashboard.
Version Logs Insights queries beside schemas. Parse structured fields directly, filter early, limit results, use appropriate time windows, and estimate scanned bytes. Test valid/error/timeout/retry and schema-version logs. Saved query availability does not guarantee fields exist or retention covers the incident.
Alarm design specifies metric/expression, dimensions, statistic/percentile, period, evaluation/datapoints-to-alarm, threshold/anomaly model, missing-data behavior, low-sample percentile behavior, actions, severity, owner and runbook. Composite alarms reduce symptom pages but can hide faults if suppression logic or child missing state is wrong. Anomaly detection learns expected ranges; it does not know business correctness.
Pages require urgent human action for user impact or imminent exhaustion. Tickets cover slower actionable risk; dashboards support exploration. Test SNS/Incident Manager or chosen routing end to end, deduplication, escalation and recovery notification. Disabled alarm actions are operational state requiring audit.
Every alarm needs an accountable team, severity, response objective, actionable runbook, expected false-positive/negative review, and test date. Route by service/environment rather than one global topic. Detect stale dashboards, deleted log groups, agent silence, alarm action changes and configuration drift through independent controls. Review alarm usefulness after incidents and remove obsolete alarms through code so abandoned pages do not train responders to ignore alerts.
Local configuration workshop
Write a redacted agent JSON for a Linux web host collecting CPU/memory/disk, procstat for the service, two structured logs with retention, and traces only if supported. Add CloudFormation/CDK resources for log groups, KMS/access, dashboard, metric filters, static/anomaly/composite alarms, SNS and runbook URLs. Validate JSON/template and review generated IAM.
/opt/aws/amazon-cloudwatch-agent/bin/amazon-cloudwatch-agent-ctl -a status
/opt/aws/amazon-cloudwatch-agent/bin/amazon-cloudwatch-agent-ctl -a fetch-config -m ec2 -s -c file:/path/agent.json
aws cloudwatch list-metrics --namespace COURSE/App --region ap-south-1
aws cloudwatch describe-alarms --alarm-name-prefix course- --region ap-south-1
aws logs start-query --log-group-name LOG_GROUP --start-time START --end-time END --query-string 'fields @timestamp, level, release, trace_id, message | filter level="ERROR" | sort @timestamp desc | limit 50' --region ap-south-1
Commands that start/reconfigure the agent belong only in an owned sandbox. Evidence-only learners inspect supplied config/status/logs.
Failure game day
Test 20 cases: role deny, wrong Region, malformed config, agent restart loop, config hash stale, log file permission, rotation loss, multiline broken, timestamp timezone, disk buffer full, secret logged, cardinality explosion, duplicate collection, metric missing, percentile low sample, alarm treats missing as good, anomaly trains on incident, composite suppresses true page, SNS delivery fails, and query scans excessive data.
For each state detection, telemetry blind spot, customer effect, safe repair/rollback, verification and cost prevention. Monitor agent health and expected telemetry freshness independently from the workload signal.
Cost, cleanup, and acceptance
Calculate metric count by namespace/dimension/resolution, log GB ingestion/storage/query, alarms/composites, dashboards/API, traces/Application Signals, canaries and cross-account transfer. This lesson creates nothing.
Submit agent config, IAM, schema/cardinality budget, dashboard JSON, five reusable queries, alarm specification/routes/runbooks, test evidence, twenty failures, cost and retention/deletion plan. Pass requires no secret, bounded cardinality, observable collector failure, user-centered dashboard, tested alarms, and reproducible IaC.