
AWS 398: Managed Prometheus and Grafana provisioning and access
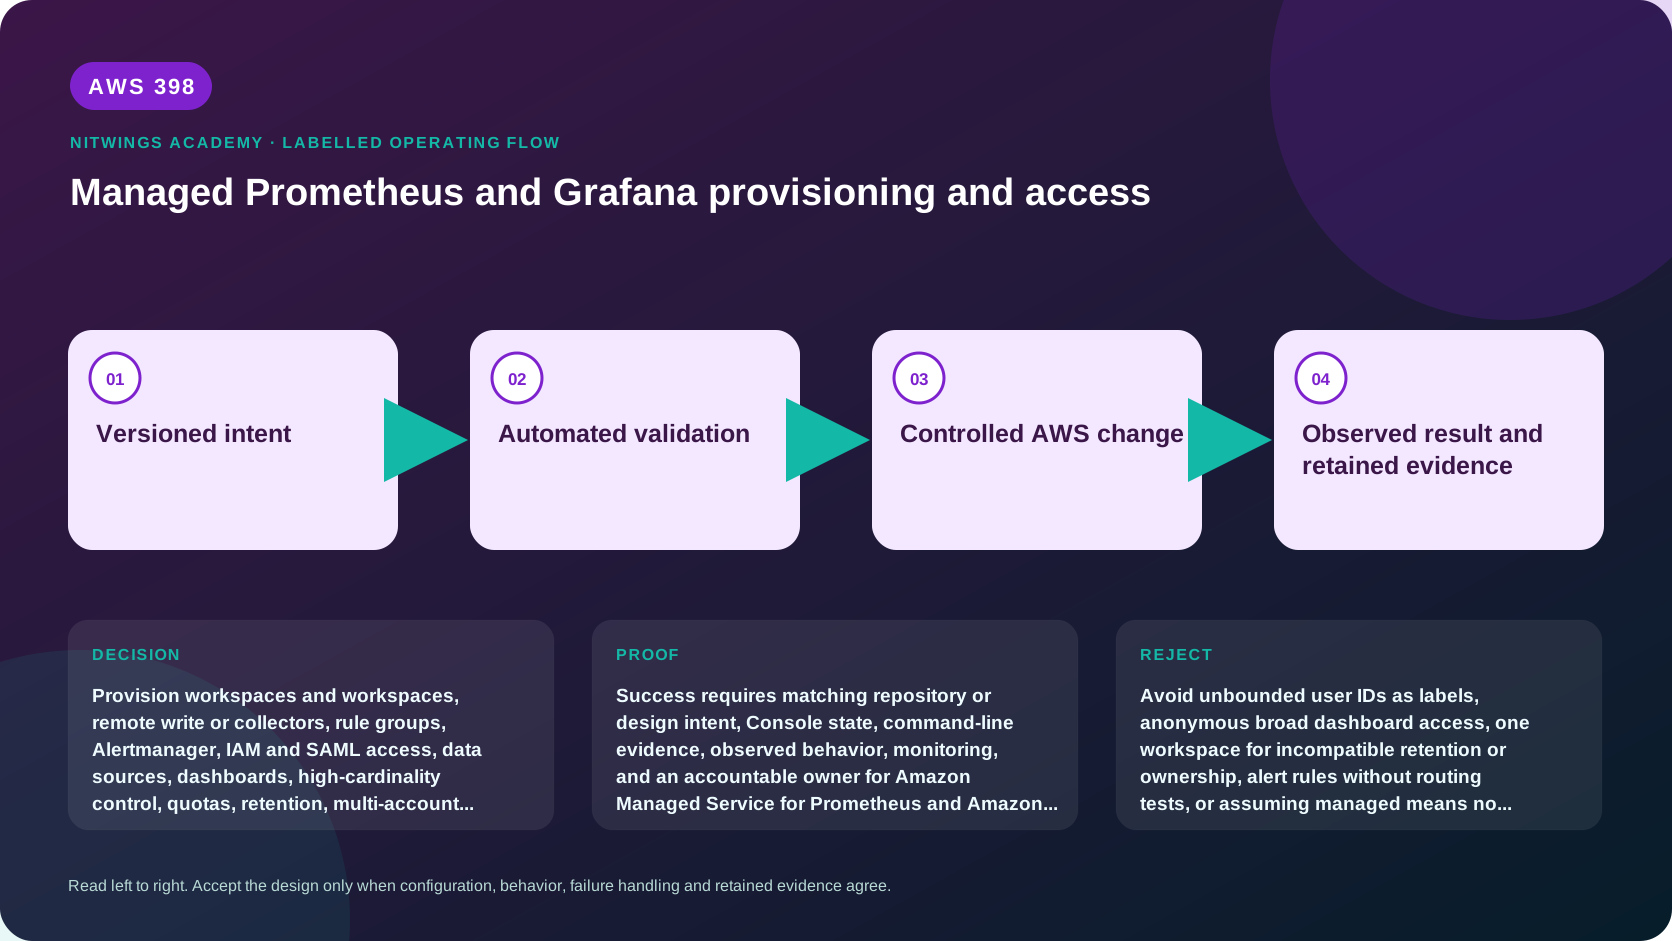
Why this lesson matters
Amazon Managed Service for Prometheus (AMP) provides managed Prometheus-compatible ingestion, storage, PromQL, rules and alert routing. Amazon Managed Grafana (AMG) provides governed visualization across data sources. AWS manages service infrastructure, but teams still own collection, identity, cardinality, queries, rules, access, dashboards, costs and incident response.
End-to-end model
workload metrics endpoint -> scraper/collector -> SigV4 remote write
 -> regional AMP workspace -> PromQL/rules/Alertmanager
-> AMG data source/dashboard/alert view -> identity and responders| Boundary | Key decision |
|---|---|
| Instrumentation | Stable metric names/types/help, bounded labels and units |
| Collection | managed scraper, ADOT/Prometheus agent, service discovery, HA duplicates |
| Ingestion | workspace/Region, SigV4 role, endpoints/network, quotas/backpressure |
| Storage/query | retention/current behavior, recording rules, query limits and ownership |
| Alerting | rule groups, Alertmanager routes, dedup/inhibit/silence and runbooks |
| Grafana | workspace auth, data-source role, folders/teams, dashboard provisioning |
Metrics use counters, gauges and histograms correctly. Labels such as request ID, user, pod UID, raw URL, exception text or unbounded tenant create series explosion. Estimate active series as the product of label cardinalities and multiply by replicas, environments and retained churn. Drop or normalize dangerous labels before remote write.
Collection and authorization
Choose one collection owner per target to avoid duplicate samples. Managed scrapers reduce collector operations where supported; ADOT or Prometheus-compatible agents add flexible processing. Define service discovery, scrape interval/timeout, relabel/drop rules, sample limits, queue capacity, WAL/buffer durability, retry/backoff, out-of-order behavior, and collector self-metrics.
Create a per-team metric contract and budget: approved prefixes, required ownership labels, prohibited labels, maximum active series/samples, scrape interval, retention assumptions and deprecation period. Measure top series contributors and churn. Reject risky instrumentation in CI where possible and provide recording-rule alternatives. Removing a label or metric is a consumer-breaking schema change, so inventory dashboards, alerts and queries before cleanup.
Remote write and PromQL/query access use SigV4-authorized IAM paths. Separate ingest, query, rule administration and workspace administration. For cross-account AMG data sources, define trusted role assumption and resource scope. Private networking/endpoints, DNS and security policies must allow required paths without broad internet exposure.
AMG access can use IAM Identity Center or SAML/current supported authentication. Map groups to workspace roles and Grafana folders/teams; avoid broad Admin. Data-source roles determine data reach regardless of dashboard folder permissions. Audit login, role and workspace changes. Never store long-lived credentials in dashboards or data-source configuration.
PromQL, rules and dashboards
Use recording rules for expensive reusable expressions and stable SLI aggregates, while controlling extra series. PromQL rate windows must suit scrape interval; aggregate without dropping dimensions needed for incident scope. Guard division by zero and missing series. Test queries against restart/reset, no traffic, duplicated collection and label changes.
Alert rules need user impact or imminent exhaustion, duration, severity, owner and runbook. Alertmanager grouping/dedup/inhibition/silence can reduce noise or hide incidents; test routing and expired silences. Grafana dashboards begin with service SLO/traffic/errors/latency, then saturation, dependencies, releases and drill-down. Provision dashboards/data sources/versioned rules as code and detect UI drift.
Back up version-controlled dashboard/rule/data-source definitions rather than relying on workspace UI state. Define workspace and data-source recovery in another Region or a documented degraded path because workspaces and metric data are Regional. Local workload alarms should survive AMG unavailability. Test identity-provider outage, read-only emergency access, workspace deletion protection and restoration of operator views without granting broad administrator access.
Read-only inspection and workshop
aws amp list-workspaces --region ap-south-1
aws amp describe-workspace --workspace-id WORKSPACE_ID --region ap-south-1
aws amp list-rule-groups-namespaces --workspace-id WORKSPACE_ID --region ap-south-1
aws amp list-alert-manager-silences --workspace-id WORKSPACE_ID --region ap-south-1
aws grafana list-workspaces --region ap-south-1
aws grafana describe-workspace --workspace-id GRAFANA_ID --region ap-south-1
Design two regional workspaces for 20 EKS clusters and one central AMG workspace. Calculate series for 50 services, 12 metrics, histogram buckets and labels; define collection topology, relabel limits, IAM, networking, rule/alert routes, group/folder access, dashboards, quotas, regional outage behavior and cost allocation.
Test 20 failures: metric type wrong, label explosion, target discovery misses, duplicate scrape, remote-write SigV4 deny, endpoint/DNS failure, queue/WAL fills, sample rejected, workspace quota, out-of-order timestamp, counter reset query, missing series treated healthy, expensive PromQL, recording rule stale, Alertmanager route wrong, silence never expires, Grafana group maps Admin, data-source role overbroad, dashboard UI drift, and one Region unavailable.
Cost and acceptance
Price ingested samples, active series/storage/query/current AMP model, collector compute/network, rule evaluation, AMG editor/viewer/workspace pricing, logs and cross-Region/account transfer. Confirm current pricing. This lesson creates nothing.
Submit architecture, series/cardinality workbook, collection/relabel config, IAM/trust, network path, PromQL/rules tests, alert routing, Grafana access/provisioning, 20 failures, cost and decommission. Pass requires bounded labels, observable collection loss, least-privilege data access, versioned dashboards/rules and regional failure handling.