
AWS 204: CloudWatch metrics and namespaces
Why this lesson matters
Metrics compress system behavior into numerical time series. That compression is useful only when the operator knows exactly who published the value, which resource dimensions identify the series, how samples were aggregated, and what absence means. This lesson prevents a common incident error: reading a plausible graph whose scope or statistic does not represent the question being investigated.
What you will be able to do
By the end, you can:
- identify one metric by account, Region, namespace, metric name and complete dimension set;
- distinguish timestamp, value, unit, storage resolution, graph period and statistic;
- choose Sum, Average, Minimum, Maximum, SampleCount or a percentile from the measurement's meaning;
- explain standard, detailed and high-resolution publication without confusing collection frequency with graph period;
- retrieve an older metric that no longer appears in
list-metrics; - diagnose empty, delayed, duplicated or misleading graphs from scope and publisher evidence;
- create a metric dictionary with an owner, expected cadence, missing-data rule and cost boundary.
Before you start
- Use a personal AWS account only when its owner has approved the lesson. Do not use the root user for daily work.
- CloudShell is the default command environment. AWS028 explains CloudShell; AWS029 and AWS030 explain local AWS CLI installation and profiles.
- The course example Region is
ap-south-1. Global services and services with a required control Region are called out in their commands. - Run
aws sts get-caller-identityprivately. Redact the account number before sharing evidence. - Never paste access keys, passwords, secret values, private object data, presigned URLs, or full account-specific ARNs into a submission.
- This is a no-create lesson. Every Console action and AWS CLI command is read-only. Create the practical artifact locally.
- Console wording can change. Use the Console service search if a menu label has moved, then confirm the current field in the official documentation.
The core model
| Question | What it means in this lesson |
|---|---|
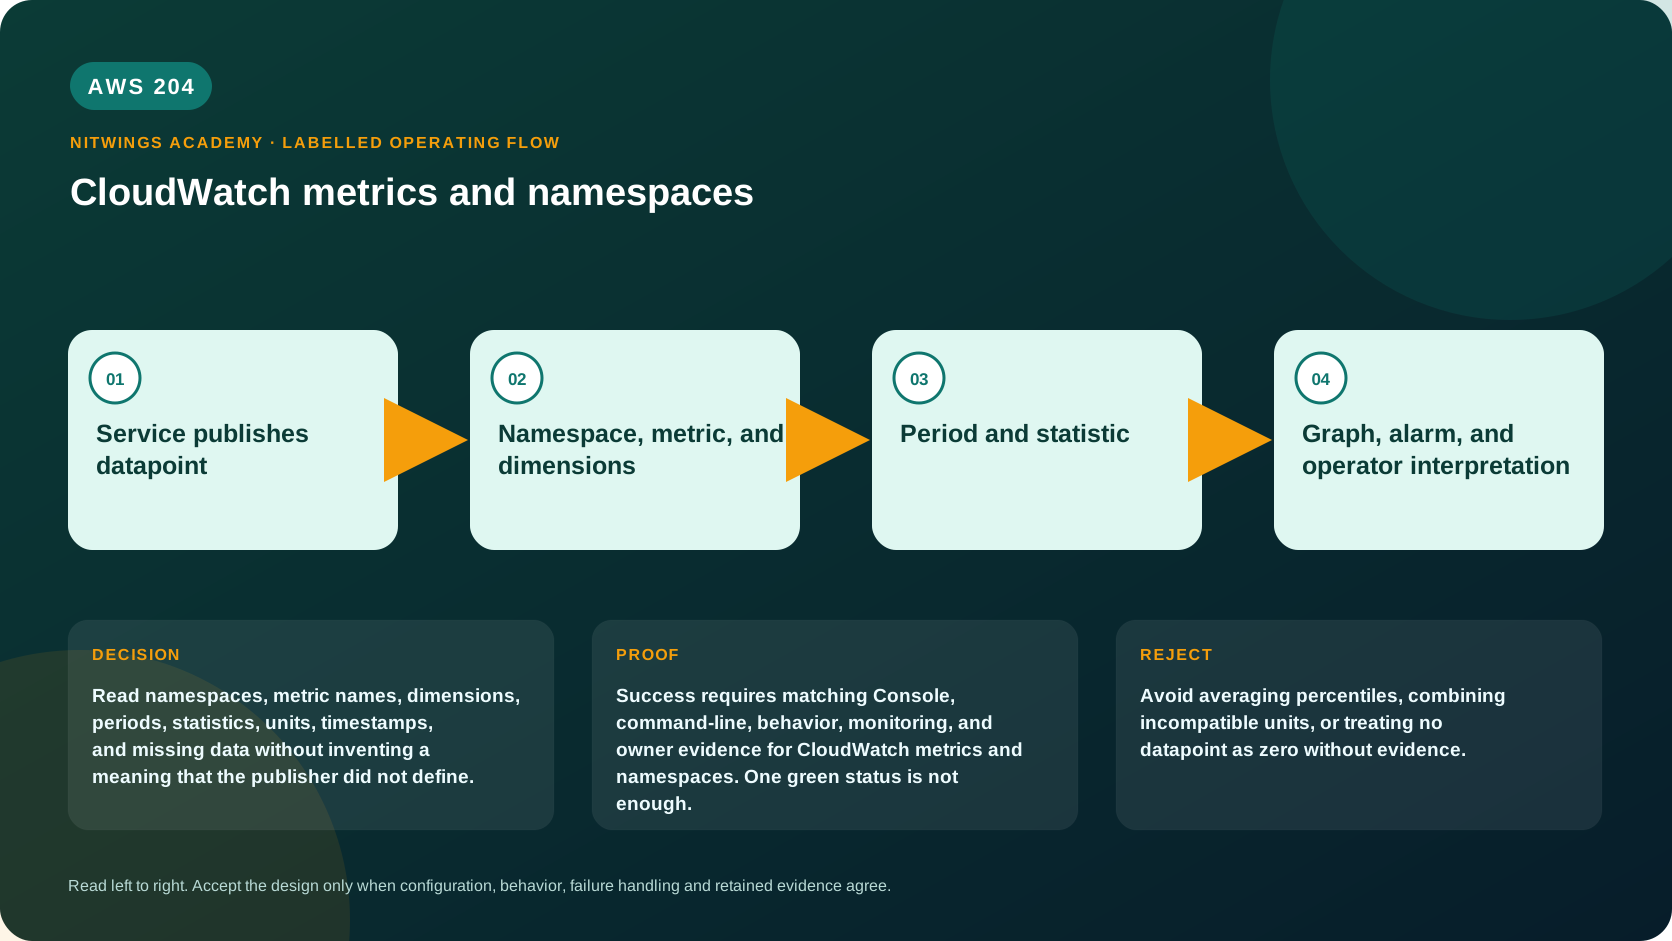
| Purpose | Read namespaces, metric names, dimensions, periods, statistics, units, timestamps, and missing data without inventing a meaning that the publisher did not define. |
| Scope and boundary | For CloudWatch metrics and namespaces, separate account and Region scope, identity, configuration, data or network behavior, failure ownership, evidence retention, and cleanup. |
| Evidence of success | Success requires matching Console, command-line, behavior, monitoring, and owner evidence for CloudWatch metrics and namespaces. One green status is not enough. |
| Cost model | Requests, running capacity, stored telemetry, retained history, data transfer, and connected resources must be priced for the exact design. |
| Safe rejection rule | Avoid averaging percentiles, combining incompatible units, or treating no datapoint as zero without evidence. |
How the request flows
+-------------------------------+
|  Service publishes datapoint  |
+-------------------------------+
               |
               v
+-------------------------------------+
|  Namespace, metric, and dimensions  |
+-------------------------------------+
                  |
                  v
+------------------------+
|  Period and statistic  |
+------------------------+
            |
            v
+---------------------------------------------+
|  Graph, alarm, and operator interpretation  |
+---------------------------------------------+
Metric identity and aggregation, deeply
A namespace is a container chosen by AWS or by the custom publisher. AWS service namespaces normally start with AWS/, such as AWS/EC2; do not publish custom metrics into those namespaces. A metric name such as CPUUtilization is not globally unique. Its full identity includes the namespace and the exact dimension-name/value combination. CPUUtilization{InstanceId=i-a} and CPUUtilization{InstanceId=i-b} are separate time series.
A datapoint has a timestamp, value or statistical set, and unit. The storage resolution says how frequently a custom datapoint was published: standard resolution is one minute; high resolution can be one second. The period says how many seconds CloudWatch groups into one displayed/evaluated point. The statistic says how values inside that period are combined. Changing a graph from five-minute Average to one-minute Maximum can reveal spikes without changing the underlying metric.
Use statistics according to meaning:
| Measurement | Useful statistic | Why |
|---|---|---|
| request count | Sum | total events during the period |
| CPU utilization | Average plus Maximum | sustained load and spikes answer different questions |
| latency | p50, p90/p95/p99 | distribution tails are hidden by an average |
| free bytes | Minimum | the lowest headroom is often the risk |
| binary heartbeat | Minimum or SampleCount | prove continuity, but first define whether zero is published |
Percentiles require suitable raw datapoints. Do not average p95 values from separate periods or hosts and call the result a fleet p95; calculate the required distribution at the correct aggregation boundary. Units are metadata rather than automatic conversion protection, so reject a graph that combines bytes, percentages and counts on one axis without explicit metric math.
CloudWatch retains sub-minute points for 3 hours, one-minute points for 15 days, five-minute points for 63 days and one-hour points for 455 days. Shorter-resolution data is aggregated as it ages. A metric with no new datapoint for two weeks can disappear from the console search and list-metrics, yet remain retrievable with get-metric-data or get-metric-statistics during retention.
Architecture decision table
| Situation | Direction | Reason |
|---|---|---|
| Requirement matches | Use metrics for numerical time-series signals whose dimensions and units are understood. | Select only after scope, behavior, security, recovery, operations, and price evidence agree. |
| Requirement does not match | Avoid averaging percentiles, combining incompatible units, or treating no datapoint as zero without evidence. | Rejecting an attractive service is a valid architecture result. |
| No create permission or cost approval | Use supplied evidence and local design work | Learning does not depend on creating an hourly resource. |
| Existing resource is unknown or unowned | Inspect only, then stop | Never change or delete a resource merely because it resembles a course example. |
AWS Management Console, step by step
Sign in with the normal non-root learning identity. Write the expected starting state before opening the service.
- Open CloudWatch > Metrics > All metrics in
ap-south-1. Record the account/monitoring-account badge and Region before choosing a namespace. - Choose
AWS/EC2, then Per-Instance Metrics. Select one approved instance and inspect the Graphed metrics row: namespace, metric, dimensions, statistic, period and axis must all be visible. - Compare one-minute and five-minute periods, then Average and Maximum over the same UTC range. Explain why the number of plotted points and apparent spikes change.
- Open the metric's source service and prove the resource ID and monitoring mode. EC2 basic monitoring normally supplies five-minute data; detailed monitoring supplies one-minute data and can charge.
- Change to a supplied stale custom metric. If browse/search cannot find it, use its known namespace/name/dimensions with the CLI rather than concluding it never existed.
- Return to the unfiltered metrics view. This lesson is read-only: do not publish a custom datapoint or save a paid dashboard/alarm.
CloudShell and AWS CLI, step by step
Start with a known caller and Region:
export AWS_DEFAULT_REGION="ap-south-1"
aws sts get-caller-identity --query Arn --output text
aws configure list
Redact the account part of the ARN in shared evidence. Now run the topic queries:
aws cloudwatch list-metrics --recently-active PT3H --query 'Metrics[].{Namespace:Namespace,Metric:MetricName,Dimensions:Dimensions}' --output json
start="$(date -u -d '1 hour ago' +%Y-%m-%dT%H:%M:%SZ)"
end="$(date -u +%Y-%m-%dT%H:%M:%SZ)"
aws cloudwatch get-metric-statistics --namespace AWS/EC2 --metric-name CPUUtilization \
  --dimensions Name=InstanceId,Value=replace-with-approved-instance-id \
  --start-time "$start" --end-time "$end" --period 300 \
  --statistics Average Maximum SampleCount --output json
Expected interpretation
list-metrics is discovery, not a datapoint query, and can omit inactive metrics. get-metric-statistics returns points that might not be time-ordered; sort by timestamp before building a timeline. Empty output can mean wrong Region, wrong dimension set, no publication in the UTC window, retention aggregation incompatible with the requested period, permission denial, or a delayed publisher. CPU alone does not prove application health because memory, process state, dependency latency and HTTP success are different signals.
Practical work
Create a metric dictionary for EC2, ALB, RDS, Lambda, and one application metric. Define publisher, dimensions, unit, period, useful statistics, normal range, missing-data meaning, owner, and cost.
Diagnose this topic from its own evidence
| Symptom | Prove first | Likely correction |
|---|---|---|
| metric not listed | account, Region, last publication and exact dimensions | query the known series directly; inspect publisher health |
| graph is unexpectedly smooth | period and statistic | shorten period or compare Maximum/percentile without changing time range |
| graph has gaps | expected publication cadence and missing-data semantics | repair publisher/agent; do not silently convert unknown to zero |
| two tools show different values | UTC range, period, statistic, unit and ingestion delay | make all query fields identical, then retest |
| alarm disagrees with graph | alarm evaluation periods, M-of-N and missing-data treatment | reproduce the exact alarm evaluation rather than eyeballing the chart |
Positive test: the known active series returns recent timestamps and the expected dimension. Negative test: query one deliberately wrong dimension value and explain why an empty result is expected. Dependency-failure test: use supplied evidence where the instance is healthy but the agent/custom publisher has stopped; separate telemetry failure from workload failure.
Cost and cleanup
Many AWS service metrics are supplied without an additional metric charge, but detailed monitoring, custom metrics, high-resolution metrics, API requests, alarms, dashboards and connected telemetry features can charge. Cardinality is a multiplier: each unique dimension combination is a distinct custom metric. Never use unbounded values such as request IDs or user IDs as dimensions. Price the expected series count, resolution, API polling rate and retention/query design using the current Regional pricing page.
Knowledge check
- What operational purpose is this lesson solving?
Expected direction: Read namespaces, metric names, dimensions, periods, statistics, units, timestamps, and missing data without inventing a meaning that the publisher did not define.
- Which scope or ownership boundary must be proved first?
Expected direction: For CloudWatch metrics and namespaces, separate account and Region scope, identity, configuration, data or network behavior, failure ownership, evidence retention, and cleanup.
- What evidence is strong enough to accept the result?
Expected direction: Success requires matching Console, command-line, behavior, monitoring, and owner evidence for CloudWatch metrics and namespaces. One green status is not enough.
- Which tempting design or shortcut must be rejected?
Expected direction: Avoid averaging percentiles, combining incompatible units, or treating no datapoint as zero without evidence.
- Which cost dimensions and retained resources need an owner?
Expected direction: Requests, running capacity, stored telemetry, retained history, data transfer, and connected resources must be priced for the exact design.
Lesson acceptance
- The metric dictionary covers EC2, ALB, RDS, Lambda and one application signal with publisher, identity, unit, cadence, statistics, normal range and owner.
- One active metric is proved in Console and CLI with matching account, Region, dimensions, UTC range, period and statistic.
- Average and Maximum are compared over the same source data and the difference is explained.
- A wrong-dimension negative test and a missing-publisher dependency test are diagnosed without calling absence zero.
- Retention tiers, two-week discovery behavior, cardinality and paid feature boundaries are stated correctly.