
AWS 319: Performance Efficiency pillar
Why this lesson matters
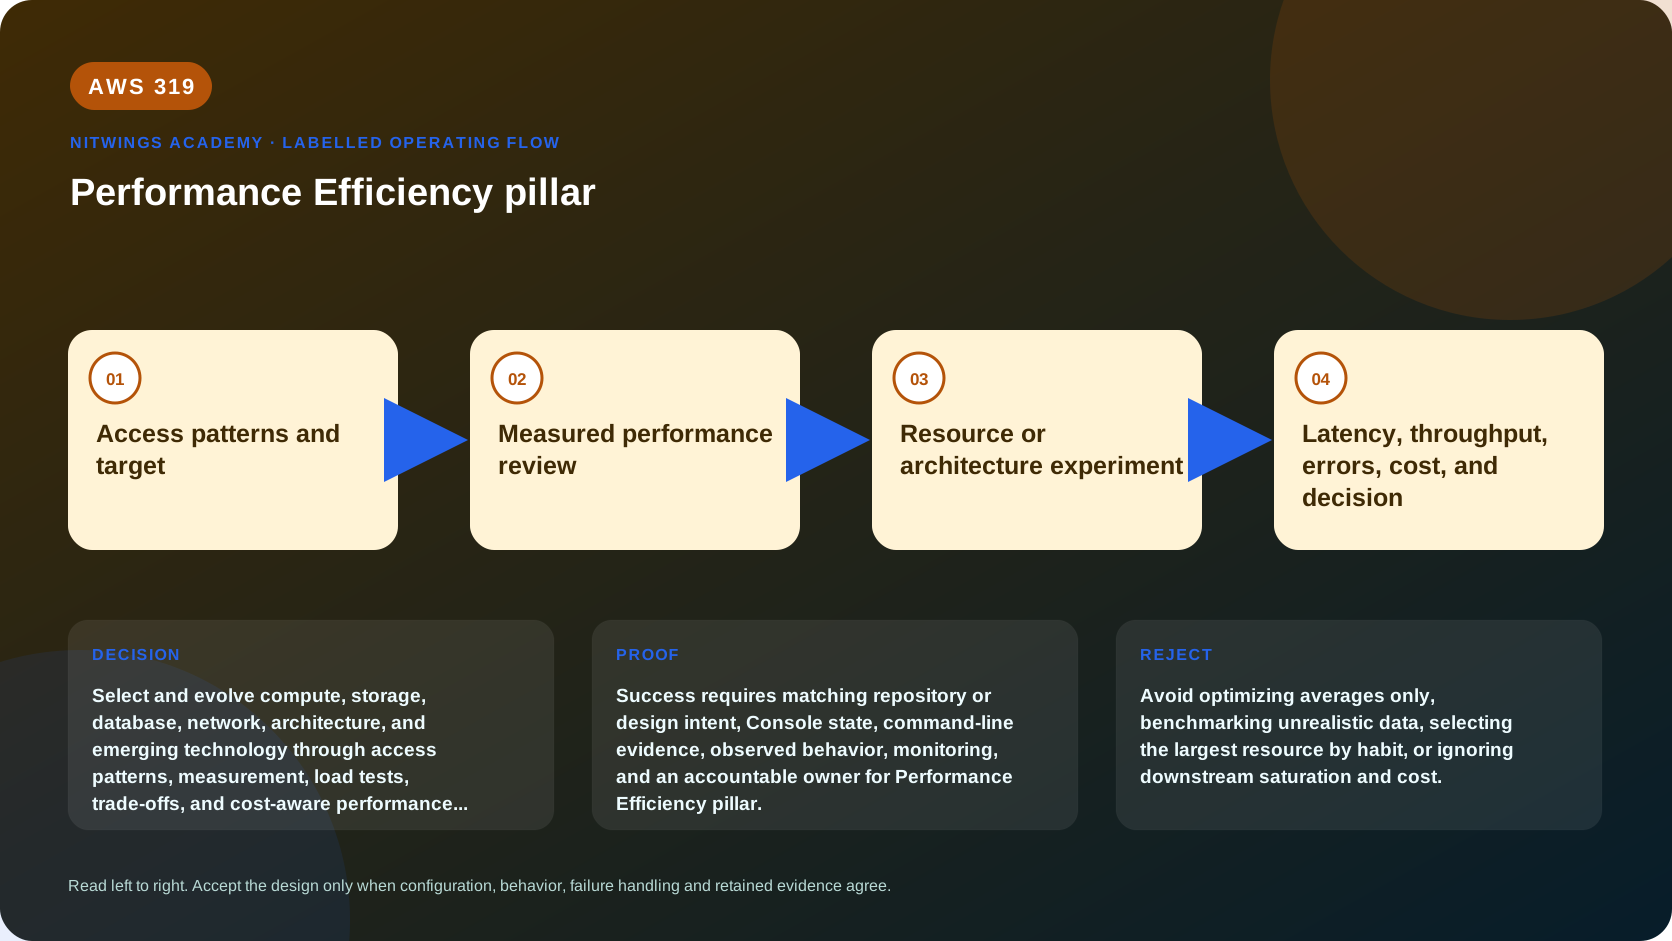
Performance Efficiency is the ability to use computing resources efficiently as demand and technologies change. Current focus areas are Architecture Selection, Compute and Hardware, Data Management, Networking and Content Delivery, and Process and Culture.
Performance is not maximum speed. It is meeting user and business objectives consistently with efficient resource use, acceptable cost, and predictable behavior at normal, peak, failure, and recovery load. Average latency can look healthy while one percent of requests time out. A larger instance can hide a lock, hot partition, oversized payload, or serial dependency until the next peak.
This lesson turns performance claims into measurements, workload models, controlled experiments, bottleneck evidence, and repeatable review.
Outcomes and prerequisites
By the end, you can:
- define user-facing and component performance objectives;
- create workload, concurrency, payload, and growth models;
- select compute, storage, database, network, cache, and acceleration from access patterns;
- distinguish benchmark, load, stress, spike, soak, scalability, and failover tests;
- interpret percentiles, throughput, saturation, queueing, and coordinated omission;
- diagnose bottlenecks with metrics, logs, traces, profiles, and query plans;
- design caching, compression, partitioning, batching, concurrency, and asynchronous work;
- establish performance regression gates and review cadence; and
- produce a defensible Performance Efficiency review.
Use synthetic or approved anonymized data. Never load-test production without written scope, capacity coordination, stop conditions, and incident contacts. T0 uses evidence and test design only.
1. Define performance from the user backward
For each critical journey record:
| Requirement | Example |
|---|---|
| Outcome | Search results render correctly |
| Latency | p95 under 800 ms, p99 under 1.5 s |
| Throughput | 1,500 requests/s sustained |
| Concurrency | 12,000 active sessions |
| Payload | p50 5 KB, p99 200 KB |
| Error | under 0.1 percent excluding rejected invalid input |
| Freshness | indexed update visible within 60 seconds |
| Growth | 2x traffic and 3x data in 18 months |
| Efficiency | cost and energy proxy per successful search |
Percentiles must define population, interval, client/server measurement, success/error treatment, warm-up, and geography. Do not average percentiles or use p99 from tiny samples.
client time = DNS + connect/TLS + edge/network + queue
            + application + dependencies + transfer/render
2. Model demand before selecting resources
Build normal, peak, launch/spike, batch-overlap, dependency-slowdown, AZ-loss, and backlog-recovery scenarios. Include requests/events per second, read/write ratio, object/record size, data growth, concurrency, session duration, cache hit ratio, hot-key distribution, and downstream quotas.
Little's Law provides a useful check:
concurrency = throughput x average time in systemAt 1,000 requests/s and 0.2 seconds average, about 200 requests are in the system on average. Tail behavior and bursts require additional headroom.
3. Select architecture from access patterns
Do not choose one technology for every component. Evaluate:
- request/response versus batch/stream/event;
- stateful versus stateless;
- relational transactions versus key-value/document/search/time-series;
- object/block/file access;
- consistency, ordering, durability, and query shapes;
- geographic users and data residency;
- CPU, memory, disk, network, GPU/accelerator needs; and
- managed versus custom operational control.
Use managed and serverless services when their behavior fits; they remove infrastructure work but retain quotas, scaling characteristics, cold starts, partition design, and cost.
Reference architectures and provider guidance are starting hypotheses. Benchmark with representative application code and data.
4. Compute and hardware
Select instance family, architecture, accelerator, size, tenancy, and purchase/running mode from profiling. CPU utilization alone is insufficient. Measure memory pressure/GC, threads, locks, context switches, disk queue/latency/IOPS/throughput, network PPS/bandwidth, accelerator utilization, and throttling.
Scale up when one process needs more memory/CPU or licensing favors fewer nodes. Scale out for parallel/stateless demand and failure isolation, subject to data/dependency limits. More application nodes can overwhelm a database connection limit.
Containers and functions still need memory/CPU/concurrency tuning. Under-memory functions may run longer; excessive memory wastes cost. Test cold and warm paths. For GPU/ML, batch size, model loading, precision, memory, and queueing determine useful throughput.
5. Data management
Select storage/database by access pattern, not brand:
- S3 for durable object access and analytics source;
- EBS for instance block workload with explicit volume/performance needs;
- EFS/FSx for supported shared/file workloads;
- RDS/Aurora for relational transactions/queries;
- DynamoDB for designed key-value/document access and partition keys;
- ElastiCache for disposable acceleration/state patterns;
- OpenSearch for search/analytics, not transaction authority;
- Redshift/Athena/EMR for appropriate analytics patterns.
Index only useful queries; every index adds write/storage cost. Inspect query plans, cardinality, scans, locks, cache, connection pools, and slow queries. Avoid N+1 calls and unbounded result sets.
Partition by high-cardinality, evenly distributed access. A high total capacity does not fix one hot key. Design lifecycle, tiering, compaction, compression, file sizes, and retention. Thousands of tiny analytics objects can dominate listing/planning overhead.
6. Network and content delivery
Measure from actual user locations. DNS, TLS, routing, proxy, firewall, NAT, load balancer, cross-AZ/Region links, MTU, packet loss, and payload size affect latency.
Place content and compute appropriately using CloudFront, Global Accelerator, Regional placement, edge features, caching, and compression according to protocol and mutability. A cache requires key, TTL, invalidation, freshness, stampede prevention, and fallback. Never cache one user's authorized data under a shared key.
Reduce chatty calls. Batch, paginate, compress, reuse connections, use efficient serialization, and move large payloads directly to object storage through controlled URLs where appropriate.
7. Test correctly
| Test | Purpose |
|---|---|
| Benchmark | Compare a component/configuration under controlled conditions |
| Load | Verify expected normal/peak behavior |
| Stress | Find saturation and failure shape beyond expected demand |
| Spike | Test sudden demand and scaling lag |
| Soak | Find leaks, drift, compaction, and long-running degradation |
| Scalability | Measure throughput/latency as resources and load change |
| Failover | Measure behavior while capacity/dependency is impaired |
Use representative datasets, distributions, cache state, think time, payload, identity, and downstream behavior. Open-loop and closed-loop load generators answer different questions. Avoid coordinated omission, where a blocked generator stops sending and hides slow responses.
Predefine steady state, ramp, duration, pass/fail, safety limits, and cleanup. Tie results to code/infrastructure/data version. Errors must count; a fast 500 response is not success.
8. Diagnose bottlenecks
Follow the request trace, not intuition:
client -> edge/LB -> queue -> application -> cache/database/service -> responseAt each hop compare arrival rate, completion rate, queue depth/age, concurrency, latency, errors, saturation, and quota. A bottleneck is often where queueing begins, not where latency is finally observed.
| Symptom | Likely evidence/action |
|---|---|
| p99 rises, average stable | Tail dependency, GC, lock, retry, hot key; inspect traces/profiles |
| CPU low but requests slow | I/O, lock, queue, connection pool, downstream latency |
| Cache improves then collapses | Stampede, eviction, hot key, invalidation; add coalescing/jitter |
| Scale-out worsens DB | Connection/query pressure; bound pools and optimize data path |
| Test is faster than production | Nonrepresentative data/cache/network/think time |
| Throughput plateaus | Fixed quota/partition/serial section; find saturation point |
9. Process and culture
Define performance budgets alongside functionality. Automate regression tests after functional tests, with stable environments and versioned results. Set thresholds based on noise/confidence; compare distributions rather than one run.
Monitor user and business KPIs plus resource/dependency signals. Review current service types/features periodically. Change only after measured hypothesis:
hypothesis -> baseline -> one controlled change -> test
 -> user/cost/reliability tradeoff -> adopt or revert
Performance optimization can reduce reliability, consistency, security, or cost. Document the trade.
10. Read-only evidence and workshop
aws cloudwatch get-metric-data --metric-data-queries file://redacted-queries.json \
  --start-time 2026-09-01T00:00:00Z --end-time 2026-09-01T01:00:00Z
aws ec2 describe-instance-types --max-results 20 --output table
aws rds describe-db-instances --output table
aws dynamodb describe-limits
aws service-quotas list-service-quotas --service-code elasticloadbalancing
Review a fictional API at 1,500 requests/s. Submit:
- user journeys/objectives;
- workload distributions and six scenarios;
- architecture/access-pattern decisions;
- compute profile/right-sizing;
- data/query/partition plan;
- network/CDN/cache plan;
- test data/environment;
- load/stress/spike/soak/failover scripts;
- instrumentation and trace map;
- baseline/bottleneck evidence;
- three optimization experiments;
- regression gate;
- quota/scaling headroom;
- cost/reliability/security tradeoffs;
- six diagnostic cases; and
- pillar findings/backlog.
Cost and cleanup
Performance testing costs load generators, test environments, data, logs/traces, network, and downstream requests. Set budget/limits and avoid production side effects. T1 cleanup removes exact test stacks, data, metrics/logs under retention, temporary quotas/configurations, and credentials.
Knowledge check
- Five areas? Architecture, compute/hardware, data, network/content, process/culture.
- Why p95/p99? Averages hide tail experience.
- Why can scale-out hurt? Shared state/dependency capacity can saturate.
- What is coordinated omission? Load generation pauses during slowness and underreports it.
- Why benchmark real access patterns? Generic results do not represent application/data behavior.
- Cache safety? Authorization-aware key, freshness/invalidation, stampede and failure plan.
- What proves improvement? Repeated controlled user-level test plus tradeoff evidence.
- Why review regularly? Demand, software, data, hardware, and AWS capabilities evolve.
Lesson acceptance
Pass when every objective has a representative test, full-path telemetry, identified saturation behavior, owner, regression gate, and documented tradeoff. Fail if average latency substitutes for tails, CPU alone drives sizing, tests omit errors or real data shape, caching ignores authorization/freshness, or scaling ignores downstream limits.