
AWS 320: Cost Optimization pillar
Why this lesson matters
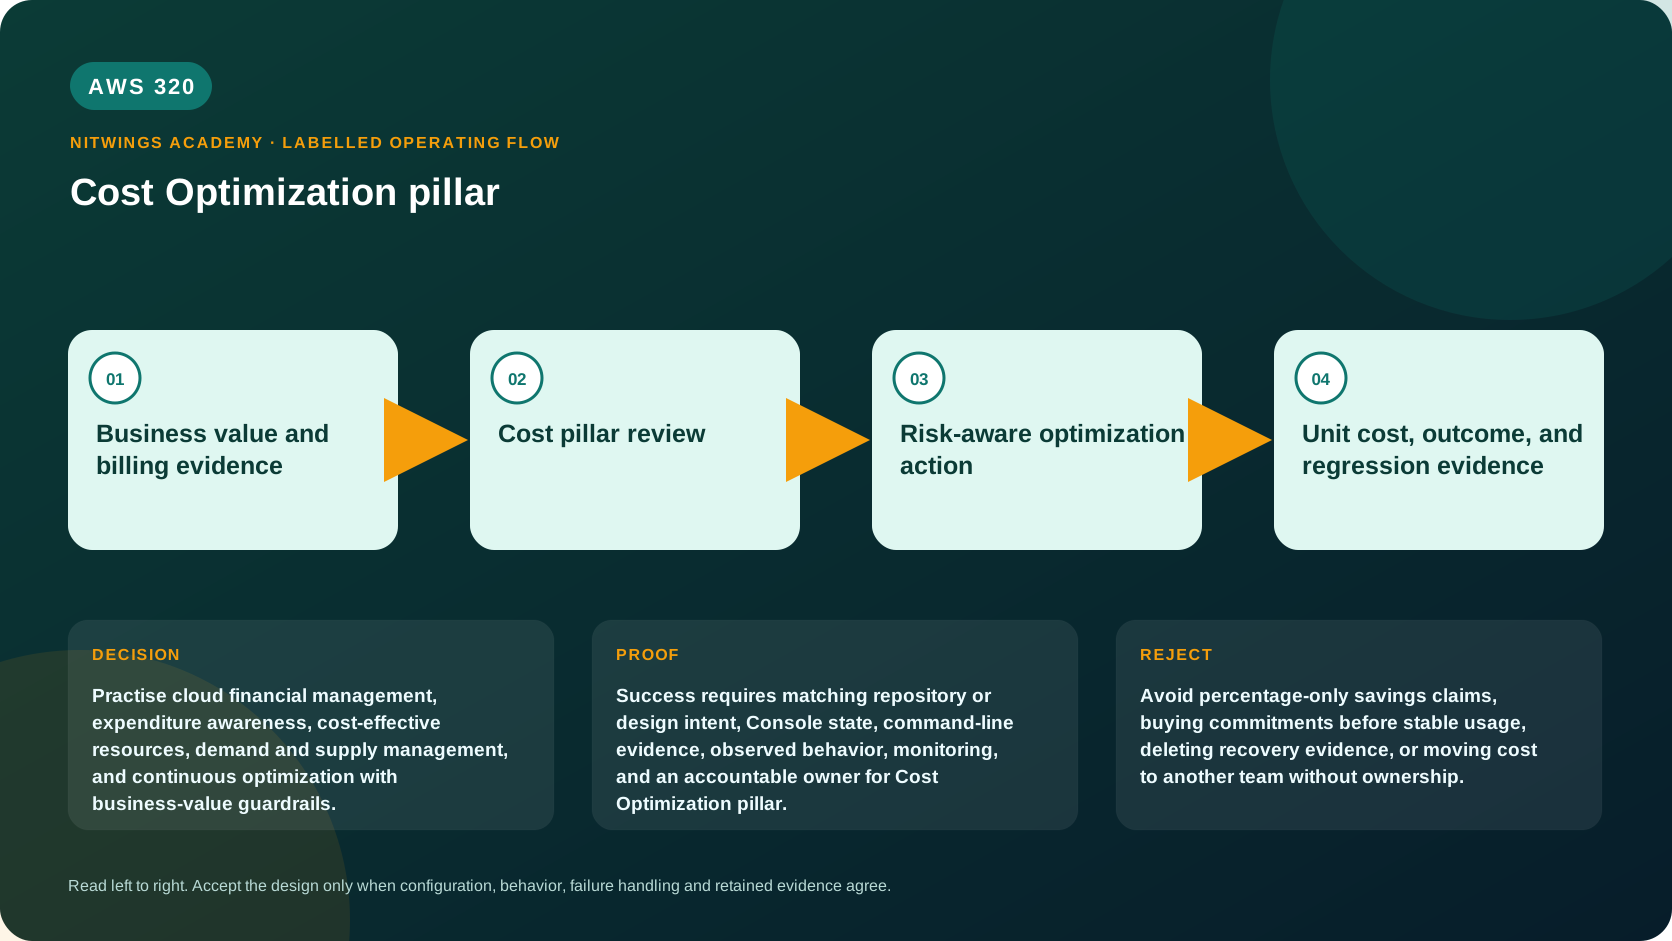
Cost Optimization is the ability to deliver business value at the lowest appropriate price point. It does not mean minimizing the bill regardless of availability, security, performance, sustainability, support, or product outcomes.
The pillar covers Cloud Financial Management, expenditure and usage awareness, cost-effective resources, demand and supply management, and optimization over time. Savings arise from architecture, usage, rates, lifecycle, and business decisions. A recommendation is not value until implemented, verified, and sustained without unacceptable harm.
What you will be able to do
By the end, you can:
- establish cost ownership, budgets, forecasts, allocation, and unit metrics;
- trace workload cost from demand and architecture to billing evidence;
- detect waste, idle/orphaned resources, lifecycle gaps, and data-transfer surprises;
- right-size compute, storage, database, and managed services with performance guardrails;
- compare on-demand, Spot, Reservations, Savings Plans, tiering, and contracts;
- match supply to demand with schedules, scaling, buffers, and throttling;
- quantify opportunity, implementation cost, risk, and realized value;
- integrate cost into design/change/incident/decommission processes;
- diagnose cost anomalies from usage, rate, allocation, and business evidence; and
- conduct an evidence-based Cost Optimization review.
Before you start
- Complete AWS314-AWS315. Use reconciled cost data and approved allocation.
- T0 does not purchase commitments, resize, stop, or delete resources.
- Redact costs, discounts, rates, account/resource IDs, budgets, contracts, and business metrics.
- Every optimization must preserve explicit security, reliability, performance, compliance, and product guardrails.
1. Apply the design principles
The five current design principles are:
- implement Cloud Financial Management;
- adopt a consumption model;
- measure overall efficiency;
- stop spending on undifferentiated heavy lifting where managed services fit; and
- analyze and attribute expenditure.
Managed services are not automatically cheaper. Compare total workload demand, idle minimums, requests, data transfer, licenses, operations, and exit cost.
2. Trace cost from business demand
business units/demand
 -> architecture and service units
 -> usage quantity
 -> pricing/rate/commitment
 -> allocation
 -> cost per outcome
For each major cost driver define unit, quantity formula, normal/peak/failure demand, price source/date/Region, discounts/commitments, transfer, logs, support, licenses, and owner.
Examples: instance-hours, vCPU/memory seconds, GB-month, IOPS, requests, scanned bytes, messages, tokens, NAT GB, inter-AZ GB, desktop hours, or transcoded minutes.
3. Practice Cloud Financial Management
Create partnership between engineering, finance, product, procurement, and leadership. Establish ownership, budgets/forecasts, cost-aware architecture/change review, reporting, anomaly response, training, and quantified business value.
Cost controls should guide and contain, not silently break workloads. Use budgets/alerts, service quotas, SCPs, approval, tagging/account vending, sandbox expiry, and maximum capacity according to risk. A budget alert does not stop spend unless a separately approved action is configured.
4. Build expenditure and usage awareness
Use CUR 2.0, Cost Explorer, allocation, tags/cost categories, and workload metrics. Track resource lifecycle from requested owner/purpose through creation, use, review, expiry, retention, and deletion.
Find:
- idle/underused compute, databases, desktops, load balancers, addresses;
- orphaned volumes, snapshots, images, logs, buckets, endpoints;
- oversized provisioned throughput/capacity;
- duplicate pipelines/tools/environments;
- stale non-production resources and preview branches;
- unnecessary inter-AZ/Region/NAT transfer;
- excessive retention, small files, scans, metrics cardinality;
- unused commitments/licenses; and
- resources without owner or business purpose.
“Idle” needs workload context. A warm standby, security log archive, spare capacity for failure, or monthly-close database can be intentionally low-utilization.
5. Select cost-effective resources
Right-size with user metrics, resource saturation, seasonality, failure headroom, and load tests. Use Compute Optimizer/Cost Optimization Hub as inputs, then validate application and license constraints.
Evaluate:
- instance family/generation/architecture and size;
- serverless versus provisioned break-even;
- managed versus self-managed TCO;
- storage class, lifecycle, retrieval, minimum-duration, and request costs;
- database engine, instance/serverless/capacity mode, I/O, replicas, backup;
- queue/stream provisioned/on-demand mode;
- log level/retention and analytics scanned data;
- data transfer path and CDN/cache/compression; and
- third-party/BYOL terms.
Moving to Graviton or Spot requires compatibility/interruption tests. Tiering data can increase retrieval latency/cost. Removing replicas can violate recovery/read capacity. Document tradeoffs.
6. Choose pricing models
Use on-demand for uncertain/short-lived demand and flexibility. Use Spot for interruption-tolerant work with diversification/checkpoint/retry. Use Savings Plans or Reservations only after stable eligible baseline, utilization/coverage, term, payment, growth, migration, and risk analysis.
Commit to baseline, not forecast peak. Model downside if demand, Region, architecture, instance family, or business changes. Central portfolios need a benefit/unused-commitment allocation policy.
Review Marketplace and license subscriptions for seats/usage, renewal, auto-renewal, private offers, minimums, and exit. Optimize usage before negotiating commitment.
7. Manage demand and supply
Demand controls:
- cache/deduplicate/batch/compress;
- archive/delete unnecessary data;
- avoid polling and duplicate retries;
- rate-limit, quota, and prioritize;
- schedule nonurgent jobs;
- reduce AI context/output/tool loops;
- improve algorithms and queries.
Supply controls:
- autoscale with correct metrics/headroom;
- schedule dev/test;
- use queues to smooth work;
- select serverless/on-demand modes for variable demand;
- stop/hibernate where behavior allows;
- scale down after safe drain; and
- preserve minimum recovery capacity.
Do not reject valuable customer demand solely to make a cost graph green. Define service and business guardrails.
8. Model data transfer
Draw every hop with source/destination AZ/Region/service, direction, GB, request, and price. Common surprises include NAT gateway processing plus internet/service transfer, cross-AZ application/database/cache traffic, centralized inspection, replication, backups, logs, and internet egress.
Use gateway/interface endpoints, same-AZ patterns, CloudFront, compression, aggregation, or architecture change only after security/reliability/performance analysis. A cheaper path that bypasses inspection is not acceptable.
9. Optimize over time
Cloud pricing, service features, instance generations, demand, data, contracts, and business value change. Establish review cadence and integrate cost into design, change, incident, and decommission processes.
Opportunity ledger:
| Field | Purpose |
|---|---|
| Baseline | Versioned usage/cost/outcome before change |
| Recommendation | Exact resource/configuration/action |
| Gross opportunity | Modeled amount and assumptions |
| Implementation cost/risk | Engineering, migration, interruption |
| Guardrails | Security/reliability/performance/business |
| Owner/date | Accountability |
| Result | Actual usage/cost/outcome after billing lag |
| Status | proposed, approved, implemented, verified, rejected, rolled back |
Avoid double-counting overlapping recommendations. Report net realized value and recurring/one-time distinction.
10. Read-only evidence
aws ce get-cost-and-usage \
  --time-period Start=2026-08-01,End=2026-09-01 \
  --granularity MONTHLY --metrics AmortizedCost \
  --group-by Type=DIMENSION,Key=SERVICE
aws cost-optimization-hub list-recommendations --output table
aws compute-optimizer get-ec2-instance-recommendations --output table
aws budgets describe-budgets --account-id REDACTED --output table
aws savingsplans describe-savings-plans --output table
Recommendations do not include every workload requirement. Redact output and validate metric/period/scope.
11. Diagnose cost changes
Decompose:
cost change = usage change + rate change + allocation change
+ discount/credit/tax change + one-time adjustment| Symptom | Evidence/action |
|---|---|
| Bill spikes after no deploy | usage type/account/resource, retries/attack, price/credit/period |
| Right-sizing saves nothing | commitment coverage, usage rebounded, wrong baseline, other bottleneck |
| Serverless costs exceed provisioned | sustained utilization, requests/duration, concurrency; model break-even |
| NAT cost rises | flow/log/CUR route, cross-AZ/service path; redesign safely |
| Storage cost falls but retrieval rises | lifecycle/retrieval/minimum-duration/request evidence |
| Commitment coverage high, utilization low | unused commitment/eligible spend; demand changed |
| “Savings” hurt latency | SLO/error/user outcome; roll back and reassess |
12. Workshop
Review a fictional $120,000/month platform. Submit:
- business demand and unit metric;
- cost-driver architecture;
- allocation/ownership;
- budget/forecast/anomaly controls;
- lifecycle/orphan inventory;
- right-sizing analysis;
- serverless/provisioned break-even;
- storage/log retention model;
- transfer map;
- commitment/Spot/license analysis;
- demand/supply controls;
- ten recommendations with guardrails;
- opportunity-to-realized ledger;
- seven diagnostic cases;
- review/decommission cadence; and
- pillar findings/backlog.
Cost and cleanup
Optimization analysis itself uses exports, Athena/BI, monitoring, recommendations, staff, testing, and migration. Include these costs in net value.
T0 creates nothing. Later experiments must tag/expire resources, preserve baseline, define rollback, remove test capacity/data/logs, and verify delayed billing.
Knowledge check
- Cost optimization goal? Lowest appropriate price for required business value and guardrails.
- Why not commit to peak? Commitments are safest against stable eligible baseline.
- What makes idle contextual? Recovery, security, periodic, and headroom roles can justify low use.
- Why trace transfer? Each hop can incur processing/transfer and expose architecture.
- Opportunity versus savings? Modeled potential versus verified net result.
- Why unit economics? It relates spend to delivered volume/value.
- Why optimize repeatedly? Demand, rates, technology, and business change.
- What invalidates savings? Unacceptable security, reliability, performance, or outcome harm.
Lesson acceptance
Pass when major costs map to demand, owners, service units, rates, allocation, outcomes, and evidence-based actions with guardrails. Fail if optimization means indiscriminate deletion, recommendations are called savings before verification, commitments lack downside analysis, transfer is omitted, or unit cost ignores quality.