
AWS 321: Sustainability pillar
Why this lesson matters
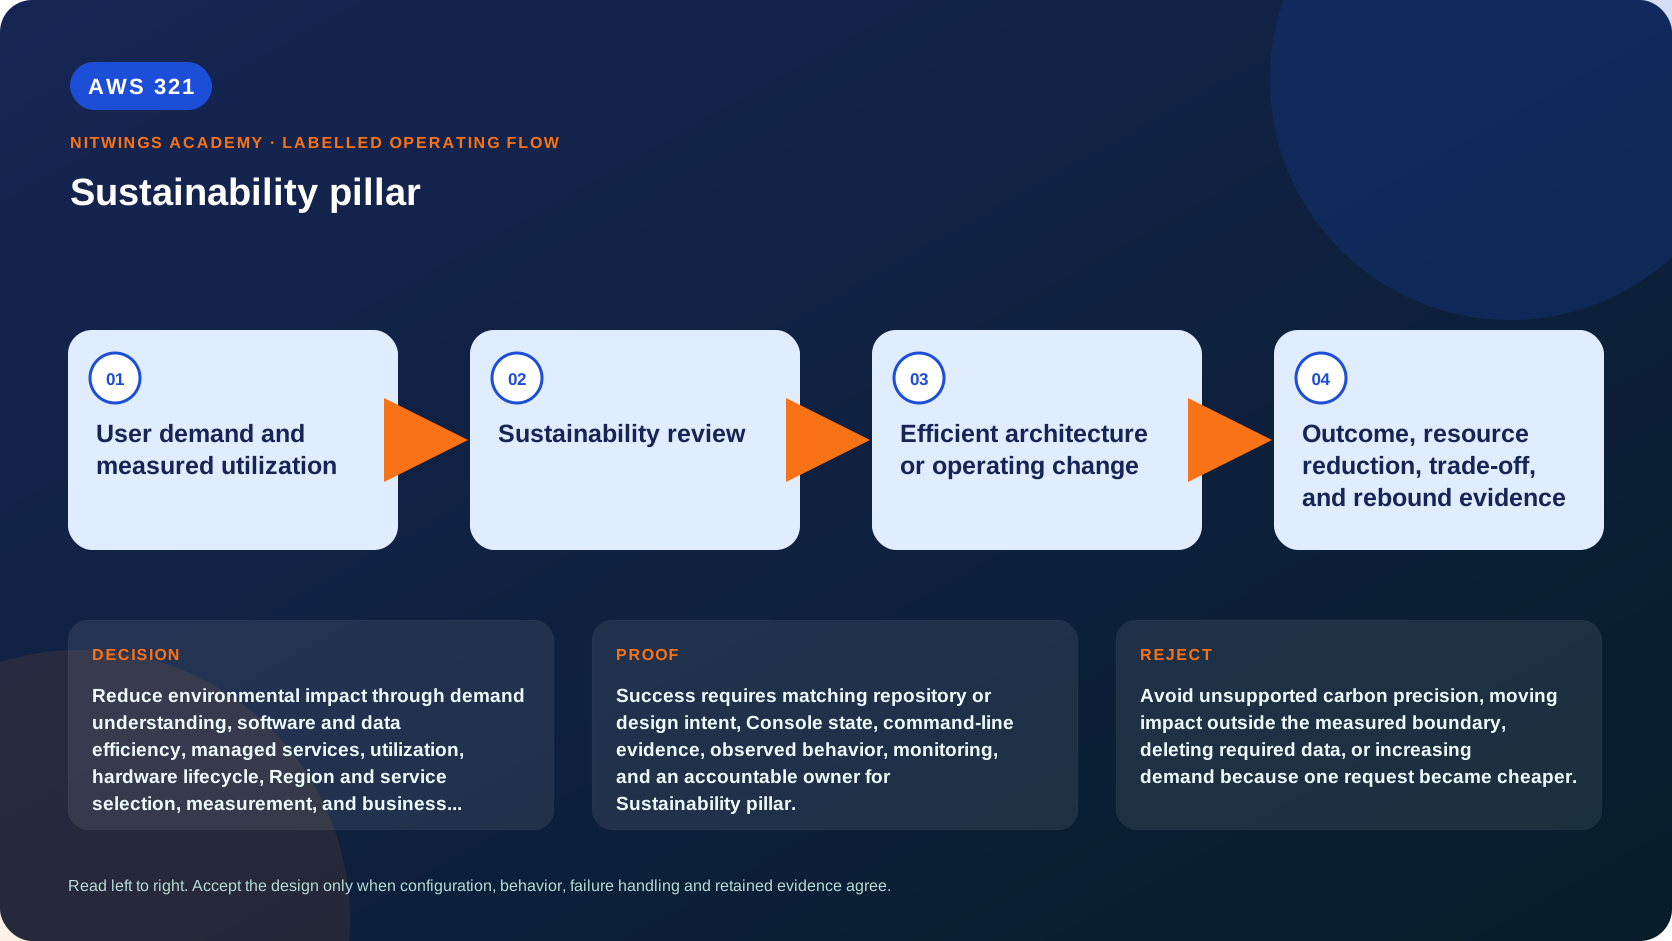
The Sustainability pillar helps architects minimize the environmental impact of cloud workloads. The goal is not a green label or an unsupported carbon number. It is to deliver the required business outcome with less computation, storage, transfer, and waste while preserving security, reliability, performance, legal obligations, and user experience.
Efficiency, cost, and sustainability often improve together, but they are not identical. A cheaper design can retain unnecessary data. A low-latency design can duplicate more data. A highly utilized resource can still run wasteful code. Sustainability must be measured against a useful unit of work, with trade-offs recorded.
Learning outcomes
By the end, you can:
- explain AWS and customer responsibilities for sustainability;
- assess all six Sustainability improvement areas;
- choose useful workload and unit metrics without claiming false precision;
- identify idle capacity, avoidable work, over-retention, and inefficient data movement;
- compare Region, software, data, managed-service, and hardware choices;
- recognize lifecycle, boundary, burden-shifting, and rebound effects;
- create an improvement plan with owners, safeguards, and acceptance evidence.
Before you start
This is a read-only lesson. Do not activate paid assessments, change production capacity, delete data, or move a workload. Use supplied evidence or resources you are authorized to inspect. An AccessDenied response is a permission boundary to document, not a reason to request broad access. Use ap-south-1 as the example Region. Redact account IDs, ARNs, customer data, and commercially sensitive usage or cost figures.
1. Sustainability and shared responsibility
AWS is responsible for sustainability of the cloud: infrastructure, facilities, energy, water, and hardware lifecycle. Customers are responsible for sustainability in the cloud: workload demand, architecture, code, data, utilization, scaling, service and Region choices, and removal of unused resources.
Connect four things:
business outcome -> workload unit -> resources consumed -> improvement evidenceA workload unit might be a successful order, analyzed image, completed report, active learner, or streamed minute. Raw instance hours and stored terabytes matter, but do not reveal efficiency as demand changes. Better measures include compute seconds per successful transaction, gigabytes per active customer, bytes transferred per page, retries per completed job, and utilization during a defined business window.
The Customer Carbon Footprint Tool and carbon-emissions data exports provide estimates, not a real-time measurement of one request. Record their covered scope, methodology, aggregation, delay, and denominator. Never invent precision the evidence does not support.
2. The six improvement areas
2.1 Region selection
Select Regions first from hard requirements: residency, compliance, service availability, customer proximity, latency, recovery, and connectivity. Environmental factors can compare candidates that remain viable. Do not relocate a workload solely because one Region appears preferable on a carbon map. A farther Region can increase transfer and latency; multi-Region recovery can duplicate capacity and data. Record and revisit the trade-off.
2.2 Alignment to demand
Build a demand profile by hour, day, season, tenant, and request type. Consider Auto Scaling, serverless services, scheduled scaling, development stop schedules, queue-based load leveling, and removal of abandoned resources.
Scaling is not automatically efficient. Bad health checks cause churn, aggressive scale-out creates excess capacity, and slow scale-in leaves idle fleets. Compare requested capacity, utilization, queue delay, throttles, and user outcomes. Keep reliability headroom that testing proves necessary.
2.3 Software and architecture efficiency
Profile before optimizing. Find repeated queries, polling, excessive retries, verbose payloads, unbounded scans, duplicate transformations, and cache misses. Improve algorithms and data access before buying larger hardware.
Batch work when latency allows, use asynchronous processing for non-interactive tasks, cache stable results with explicit invalidation, compress suitable payloads, and move events instead of repeatedly polling state. Bound retries and use backoff, jitter, idempotency, and dead-letter handling so failures do not multiply work. Managed and serverless services may reduce idle infrastructure, but request shape, minimum capacity, transfer, and quotas still require testing.
2.4 Data efficiency
Classify data by value, sensitivity, access frequency, retention obligation, recovery need, and deletion date. Store only what is required. Use lifecycle policies, expiration, tiering, compaction, deduplication, compression, and suitable analytics formats.
Replication and backup are reliability controls, not waste by default. Right-size scope and retention. Include logs, snapshots, object versions, incomplete uploads, caches, indexes, and test data in the inventory. Avoid whole-dataset copies when incremental or aggregated transfer meets the need.
2.5 Hardware and service choices
Use current-generation, right-sized resources. Compute Optimizer, application profiles, and load tests inform decisions but do not authorize automatic changes. Compare CPU, memory, storage, network, accelerators, compatibility, and licensing. Graviton can improve price-performance for compatible software. Accelerators can be efficient for suitable work, but an underused GPU is not sustainable. Validate managed-service or hardware changes for security, resilience, performance, and rollback.
2.6 Process and culture
Assign an owner, establish measurable goals, include sustainability in architecture and operational reviews, and maintain an improvement backlog. Review after demand changes, releases, incidents, migrations, acquisitions, and AWS service launches. Small repeated improvements often matter more than a one-time redesign.
3. Measurement boundaries and traps
State accounts, Regions, services, environments, dates, users, and lifecycle stages included in every claim. Otherwise work can simply move outside the boundary.
- Burden shifting: compute falls while storage or transfer grows greatly.
- Rebound effect: cheaper work drives enough demand to increase total usage.
- Survivorship bias: successful requests are measured but retries and failures are omitted.
- Idle exclusion: busy hours look efficient while nights remain wasteful.
- Lifecycle omission: backups, downstream work, or retained data are ignored.
- Proxy confusion: cost or CPU is presented as exact environmental impact.
Cost is a useful waste signal but not a complete carbon measure. State what every proxy shows and what it cannot show.
4. Read-only evidence collection
export AWS_DEFAULT_REGION="ap-south-1"
aws sts get-caller-identity --query Arn --output text
aws configure get region
aws compute-optimizer get-enrollment-status --output json
aws compute-optimizer get-ec2-instance-recommendations --max-results 20 --output json
aws autoscaling describe-auto-scaling-groups \
  --query 'AutoScalingGroups[].{Name:AutoScalingGroupName,Min:MinSize,Desired:DesiredCapacity,Max:MaxSize}' \
  --output table
aws cloudwatch list-metrics --recently-active PT3H --output table
aws s3api list-buckets --query 'Buckets[].{Name:Name,Created:CreationDate}' --output table
The commands do not prove that a recommendation is safe, a bucket is unused, or emissions decreased. Correlate inventory with owners, metrics, retention, application behavior, cost, and outcomes. list-metrics discovers metrics; approved metric queries with explicit time ranges produce utilization evidence.
In the Console, inspect Well-Architected Tool Sustainability questions, Compute Optimizer, CloudWatch, Cost Explorer usage patterns, S3 lifecycle configuration, and Customer Carbon Footprint Tool when permitted.
5. Decision record
For each improvement record:
| Field | Required question |
|---|---|
| Outcome | What user result remains protected? |
| Baseline | Which dated metric and workload unit describe today? |
| Waste hypothesis | Which avoidable resource or work exists? |
| Change | What exact change is proposed? |
| Guardrails | Which security, resilience, performance, and legal limits apply? |
| Expected effect | Which metric should improve and why? |
| Rebound check | Could efficiency increase total demand? |
| Validation | Which test, dashboard, bill, or inventory proves the result? |
| Rollback | Which signal stops or reverses the change? |
| Owner | Who accepts it, and when is it reviewed? |
Prefer reversible experiments, representative periods, retained baselines, and user-outcome checks.
6. Guided workshop: learning platform
A global learning platform runs continuously although most learners are active twelve hours daily. It retains video derivatives, logs, snapshots, and development databases indefinitely. Clients poll every five seconds for job completion. A monthly report uses a large instance for three hours. Requirements include 99.9% monthly availability, four-hour RTO, one-hour RPO, seven-year completion-record retention, and temporary-upload deletion after 30 days.
Create these artifacts:
- Outcome statement and workload unit.
- Scope boundary listing accounts, Regions, environments, services, and dates.
- Peak, normal, idle, and seasonal demand profile.
- Resource inventory with owners and utilization evidence.
- Region decision covering latency, residency, service availability, and environment.
- Scaling proposal with reliability headroom.
- Polling-to-event or backoff proposal with retry safeguards.
- Software profiling hypothesis and test.
- Data classification and retention table.
- Lifecycle proposal for uploads and derivatives.
- Backup and replication justification tied to RTO and RPO.
- Hardware or managed-service comparison for reporting.
- Baseline and target per successful learning completion.
- Risk, rebound, and burden-shifting register.
- Validation and rollback plan.
- Prioritized backlog with owners and review dates.
Do not delete required replicas, schedule production off merely because demand is low, or optimize an average that hides peak users.
7. Troubleshooting claims
| Symptom | Likely problem | Correction |
|---|---|---|
| Cost fell but storage grew | Boundary excluded retained data | Expand scope and use a unit metric |
| CPU is low | Memory, IO, or bursts were ignored | Profile before resizing |
| Serverless bill rose | Chatty calls, retries, or poor batching | Remove duplicate work and load test |
| Lifecycle saved little | Versions or incomplete uploads excluded | Inventory every retained copy |
| Carbon estimate is unchanged | Reporting delay or aggregation | Verify period and use operational proxies meanwhile |
| Unit efficiency improved but total use rose | Demand growth or rebound | Report both trends and control waste |
Cost, safety, and cleanup
This lesson creates no resources. If an authorized later lab creates test resources, tag them, set a budget, list dependencies, and verify deletion through inventory and billing. Never delete an unknown resource because it looks idle.
Knowledge check
- Why is cost not a complete sustainability metric?
Answer: Price includes commercial factors and does not precisely represent energy, carbon, water, hardware lifecycle, or work outside the billing boundary.
- Should the lowest-carbon Region always be selected?
Answer: No. Residency, compliance, availability, latency, and resilience constrain viable Regions first.
- Why measure per successful transaction?
Answer: It separates efficiency from demand and connects resource use to an outcome.
- Is low CPU enough to downsize?
Answer: No. Memory, storage, network, bursts, latency, and recovery headroom also matter.
- What is rebound risk?
Answer: Efficiency lowers cost or friction, but resulting demand growth keeps total use flat or increases it.
Lesson acceptance
Submit all 16 artifacts, define scope and a workload unit, cover all six improvement areas, separate evidence from assumptions, preserve mandatory requirements, identify rebound and burden-shifting risks, and provide measurable validation, rollback, owner, and review date for every selected change.