
AWS 339: Data Exports, CUR evidence, allocation, forecasting, and unit economics
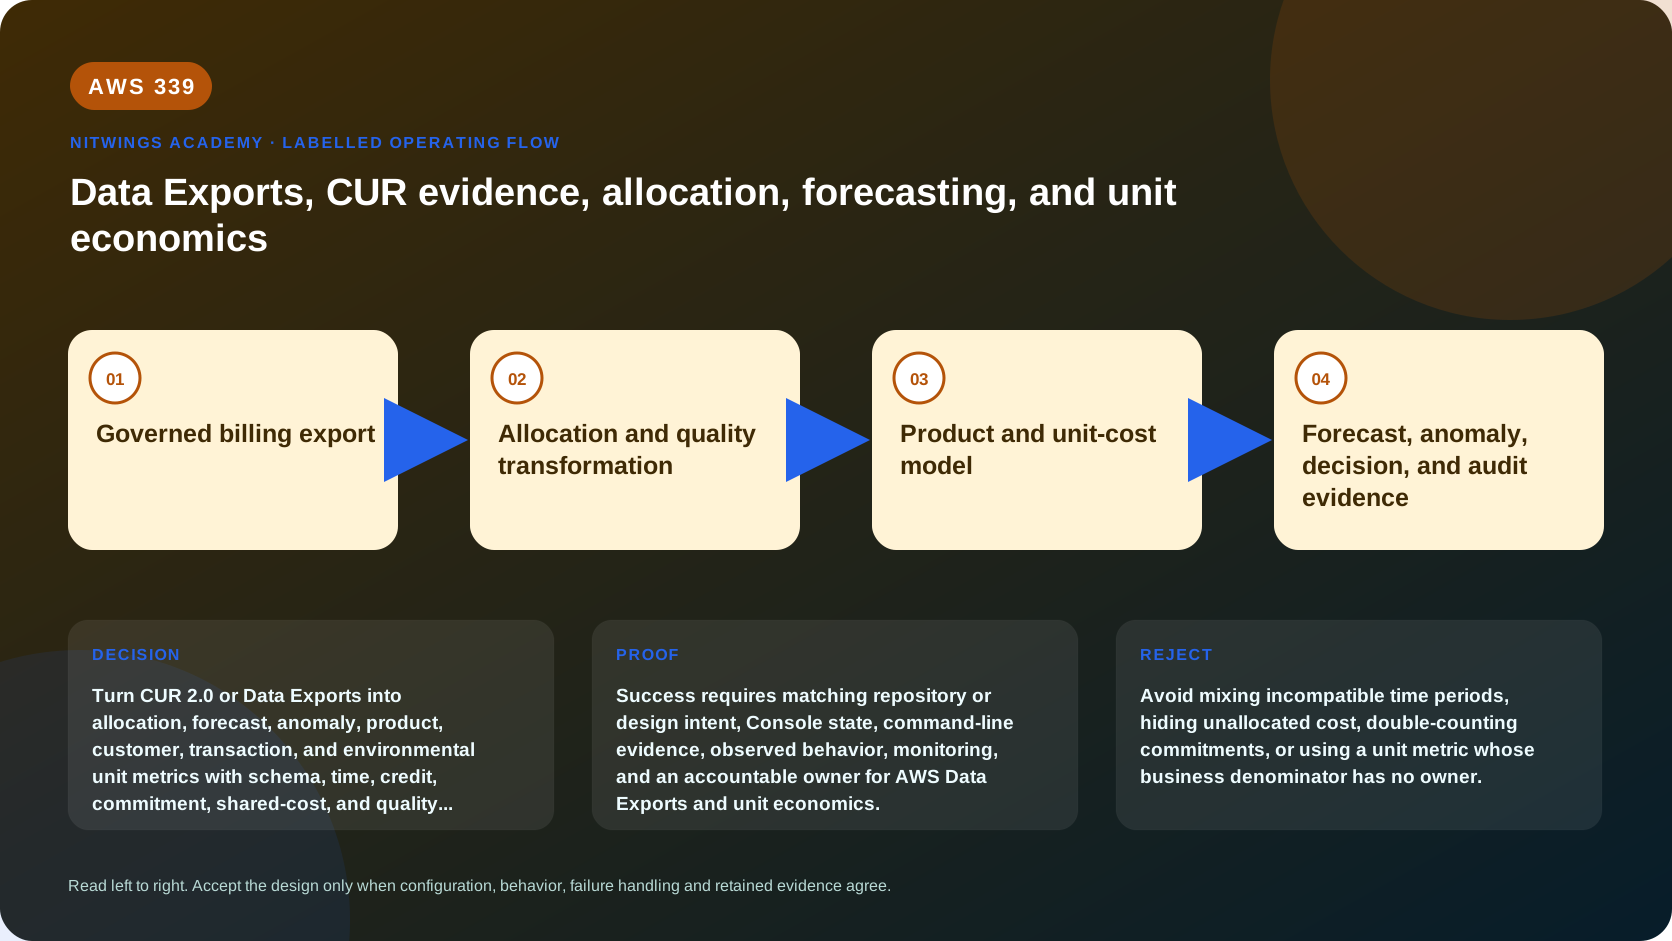
Why this lesson matters
Pricing estimates become useful only when actual cost and usage can be reconciled to architecture and business outcomes. AWS Data Exports and CUR 2.0 provide detailed billing evidence, but line items require governed schema, time, cost-metric, allocation, discount, credit, commitment, and data-quality decisions before they support action.
Unit economics connects cloud consumption to a successful order, active customer, shipped parcel, or analyzed document. A misleading denominator or hidden unallocated cost can make an inefficient product appear efficient.
Learning outcomes
By the end, you can:
- distinguish CUR, CUR 2.0, Data Exports, Cost Explorer, Budgets, and anomaly detection;
- design a secure CUR 2.0 export and analytical pipeline;
- handle manifests, refreshes, overwrite/create-new delivery, and late adjustments;
- choose cost metrics for invoice, management, and commitment analysis;
- allocate direct, shared, commitment, credit, and unallocated cost transparently;
- create forecasts and anomaly actions with known delay/uncertainty;
- calculate cost per business unit with quality controls;
- reconcile estimate, forecast, export, and invoice.
1. Cost data products
| Product | Best use | Important boundary |
|---|---|---|
| Data Exports CUR 2.0 | Detailed customizable billing export | Refreshing data, schema/metric expertise required |
| Legacy CUR | Existing detailed pipelines | Variable columns and migration planning |
| Cost Explorer | Interactive cost/usage trends and forecasts | Aggregated view and processing delay |
| Budgets | Actual/forecast threshold notifications/actions | Not real-time usage enforcement |
| Cost Anomaly Detection | ML-based unusual spend detection | Cost Explorer delay, learning period, false positives |
| Pricing Calculator | Planned architecture/usage estimate | Not actual billing evidence |
Data Exports can query CUR 2.0 with supported SQL column selection/filtering/aliasing and table configurations. CUR 2.0 uses a fixed schema with nested key-value columns, unlike legacy CUR's month-dependent tag/cost-category columns.
2. Export design
Define payer/management owner, export purpose, table, SQL query, time granularity, resource-level and split-cost-allocation settings, file format, compression, S3 Region/bucket/prefix, refresh mode, access, encryption, retention, catalog/query engine, and consumer SLA.
Table configurations affect table content before the query and cannot be changed after export creation; replacing an export may be required. Select only needed columns, but retain fields necessary for reconciliation and future allocation.
Typical dimensions/measures include billing period, usage start/end, payer and usage accounts, invoice/bill identifiers, service/product, Region, usage type/operation, resource, line-item type, usage amount, currency, unblended/net/amortized cost, reservation/Savings Plans data, credits/fees/tax/refunds, cost categories, and resource tags. Verify exact current CUR 2.0 dictionary names.
3. Delivery semantics
CUR 2.0 billing-period partitions refresh at least daily while source data changes. AWS can update the previous billing period during the first two weeks after close. Therefore a “final” month needs a documented closing rule and revision handling.
Each delivery includes data plus manifest metadata. Consume the manifest rather than assuming one file. Large exports have chunks. In overwrite mode, current partition files are replaced and extra old chunks may become empty. In create-new mode, timestamp/execution directories preserve refreshes but use more storage. Your ingestion must be idempotent and prevent duplicate summation.
Track export execution/status, manifest version, row/file counts, min/max usage dates, duplicate key checks, total costs by line-item type, and late revisions. Preserve raw evidence according to finance policy.
4. Secure pipeline
Billing/Data Exports -> protected S3 raw zone -> catalog/Athena
-> validated normalized tables -> allocation -> unit metrics/dashboards
Use least-privilege delivery and analyst roles, bucket policy, Block Public Access, encryption/key policy, protected audit logs, query workgroups, scan limits, lifecycle, and separate finance-approved outputs. Billing data exposes account names, resources, tags, usage, rates, discounts, and business structure.
Do not let dashboard users browse raw data by default. Define row/column access and sanitized exports.
5. Cost metric semantics
Choose metric by question:
- Unblended cost: line-item rates charged to usage accounts before allocation of some discounts;
- Net unblended: includes applicable discounts/refunds after calculation where available;
- Amortized cost: spreads upfront/recurring commitment cost and applies benefits over usage;
- Net amortized: includes applicable discounts/refunds with amortization;
- Invoice reconciliation: use invoice-aligned fields and finance rules, not an arbitrary management view.
Do not mix metrics across numerator components. Separate usage, fees, credits, refunds, tax, support, RI/Savings Plans purchases, and amortization. Document whether credits reduce product accountability or remain centrally reported.
6. Allocation hierarchy
Allocate in transparent stages:
- direct account/resource ownership;
- governed tags and cost categories;
- application/product mapping;
- shared service allocation with causal driver;
- commitment/discount policy;
- credits/refunds/tax/support policy;
- visible
UNALLOCATEDremainder.
Never force 100% allocation with invented precision. Unallocated cost is a data-quality and ownership signal. Shared drivers may be request count, active users, storage, direct spend, headcount, equal share, or fixed subscription. State why the driver reflects consumption and test sensitivity.
Account transfers, tag changes, backdated cost categories, shared resources, Marketplace, and data transfer need effective-date rules. Preserve raw and allocated totals so finance can reconcile.
7. Commitment treatment
Savings Plans and RI costs/benefits can cross accounts under consolidated billing. Decide whether owners see on-demand-equivalent, effective/amortized, or chargeback rates. Show commitment coverage, utilization, unused commitment, and benefit-sharing policy separately.
Avoid double counting: do not add commitment purchase and fully amortized covered usage into the same cost measure. Finance owns commercial treatment; product teams need explainable cost signals.
8. Unit economics
Define:
unit cost = governed allocated cloud cost / successful business unitsThe denominator comes from an owned business system with definition, timezone, late-data policy, quality checks, and reconciliation. “Order” must specify successful, canceled, refunded, test, duplicate, and partial states.
Align numerator and denominator period, product, geography, and environment. Include failed/retried technical work in cost numerator because it consumed resources. Report total cost, volume, and unit cost together. A falling unit cost can coexist with rising total spend.
Create drill-down from unit metric to product, service, account, Region, usage type, resource, and allocation rule. Protect customer-level metrics.
9. Forecasting
Cost Explorer forecasts use historical usage and provide estimated future cost with a prediction interval. Current guidance uses an 80% prediction interval when sufficient data exists. New accounts/services and structural changes can make historical forecasts unreliable.
Build a driver-based forecast alongside statistical forecast:
business volume x architecture quantity per unit x effective rate
+ fixed/platform costs + migration/DR/commitment effects
Reconcile both and explain differences. Version demand, releases, migration waves, commitments, seasonality, price/discount, and currency assumptions. Track forecast bias and absolute error after close.
10. Anomaly detection and response
Cost Anomaly Detection uses Cost Explorer data and is not real-time; current documentation notes delay can reach 24 hours. Define monitors by service/account/tag/cost category where supported, threshold/subscription, finance/product recipients, incident severity, and action.
Runbook:
- validate anomaly period and processing delay;
- identify service, account, Region, usage type, and resource drivers;
- correlate deployment, incident, demand, retry, and pricing changes;
- check allocation/tag changes and late billing adjustments;
- contain only with workload owner and safety review;
- document cause, impact, correction, and detection improvement.
Do not terminate resources automatically from cost signal alone.
11. Quality and reconciliation
Tests include expected partitions/manifests, schema/query fingerprint, row/chunk count, duplicate prevention, billing-period/date coverage, currencies, null account/product mapping, valid line-item types, raw versus normalized totals, allocation conservation, unallocated percentage, numerator/denominator period match, and invoice variance.
Use a close calendar: provisional daily, preliminary month close, late-adjustment window, finance-approved final, and restatement process. Never silently overwrite a published dashboard after finance sign-off.
12. Read-only discovery
aws bcm-data-exports list-exports --region us-east-1 --output table
aws cur describe-report-definitions --region us-east-1 --output table
aws athena list-work-groups --output table
aws glue get-databases --output table
These calls may expose sensitive finance metadata and require approved billing access. This lesson does not create an export or run paid Athena queries.
13. Guided workshop
Design monthly cost per successful order and active customer. Produce:
- metric charter and owners;
- export/query/table-configuration specification;
- selected CUR 2.0 columns and rationale;
- delivery/manifest/refresh ingestion state machine;
- raw-zone security and retention;
- normalized schema and metric definitions;
- direct ownership mapping;
- tag/cost-category governance;
- shared-cost driver table;
- commitment/credit/support/tax policy;
- visible unallocated-cost treatment;
- business denominator contract;
- unit-cost SQL/pseudocode and drill-down;
- data-quality/reconciliation tests;
- statistical and driver forecast;
- forecast-accuracy process;
- anomaly response runbook;
- close/restatement/access/audit process.
Cost and cleanup
The design path is T0. A production pipeline incurs S3, catalog/crawler if used, Athena scans/workgroups, transformation, dashboard, logs, KMS, transfer, and engineering costs. Optimize partitioning/columnar formats and query controls. There is no cloud cleanup in this lesson.
Knowledge check
- Why can last month's export change? AWS may post late adjustments after period close.
- Why use the manifest? It defines files for a specific export refresh.
- Should unallocated cost be hidden? No; expose it as an ownership/data-quality measure.
- Can anomaly detection stop waste instantly? No; billing processing can be delayed and containment needs workload evidence.
- What makes unit cost valid? Governed matching numerator/denominator, scope, period, and quality.
Lesson acceptance
Submit all 18 artifacts. Raw-to-unit totals must reconcile, metric semantics and allocation must be explicit, late revisions must be controlled, unallocated cost visible, forecasts measured, anomaly action safe, and every business denominator owned.