
AWS 211: AWS X-Ray, CloudWatch Application Signals, and OpenTelemetry tracing
Why this lesson matters
Distributed tracing follows one request across process and service boundaries so latency and errors can be assigned to the responsible dependency. It works only when trace context is propagated, spans use stable service/resource attributes, sampling preserves representative evidence and logs can correlate by trace/request ID. For new instrumentation, AWS recommends OpenTelemetry; the older X-Ray SDKs and daemon are now in maintenance mode.
What you will be able to do
By the end, you can:
- distinguish trace, span, parent/child relationship, link, event, attribute and resource;
- propagate W3C trace context across synchronous calls and reason about asynchronous links;
- choose OpenTelemetry/ADOT instrumentation and a CloudWatch agent or OTel collector path;
- explain head sampling, sampling bias and why one trace is not an availability statistic;
- use X-Ray trace/map evidence and Application Signals service/dependency/SLO views together;
- correlate trace ID with structured logs and metrics without recording secrets or personal data;
- diagnose missing spans, broken parentage, service-name explosion and collector export failure.
Before you start
- Use a personal AWS account only when its owner has approved the lesson. Do not use the root user for daily work.
- CloudShell is the default command environment. AWS028 explains CloudShell; AWS029 and AWS030 explain local AWS CLI installation and profiles.
- The course example Region is
ap-south-1. Global services and services with a required control Region are called out in their commands. - Run
aws sts get-caller-identityprivately. Redact the account number before sharing evidence. - Never paste access keys, passwords, secret values, private object data, presigned URLs, or full account-specific ARNs into a submission.
- This is a no-create lesson. Every Console action and AWS CLI command is read-only. Create the practical artifact locally.
- Console wording can change. Use the Console service search if a menu label has moved, then confirm the current field in the official documentation.
The core model
| Question | What it means in this lesson |
|---|---|
| Purpose | Instrument new tracing with OpenTelemetry or ADOT, send traces to X-Ray and CloudWatch, and correlate services, spans, metrics, logs, sampling, and service-level objectives. |
| Scope and boundary | For X-Ray, Application Signals, and OpenTelemetry, separate account and Region scope, identity, configuration, data or network behavior, failure ownership, evidence retention, and cleanup. |
| Evidence of success | Success requires matching Console, command-line, behavior, monitoring, and owner evidence for X-Ray, Application Signals, and OpenTelemetry. One green status is not enough. |
| Cost model | Trace recording, Application Signals, custom metrics, logs, collector capacity, and retained telemetry can charge. |
| Safe rejection rule | Avoid starting new code on maintenance-mode X-Ray SDKs or recording secrets and high-cardinality personal data in span attributes. |
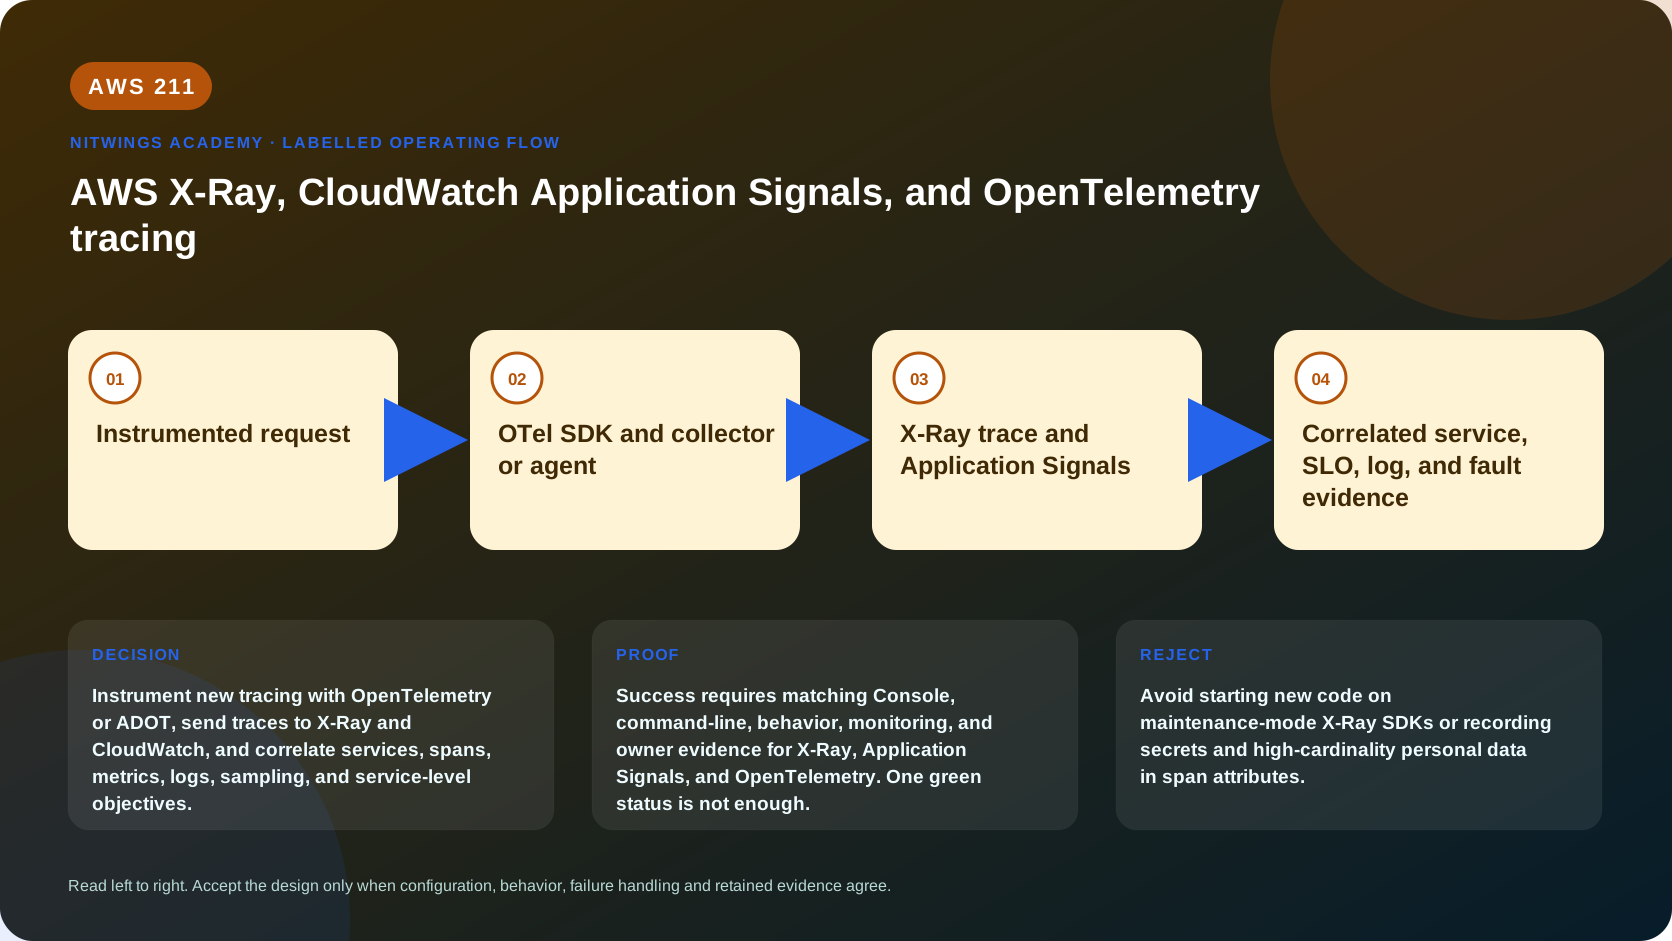
How the request flows
+------------------------+
|  Instrumented request  |
+------------------------+
            |
            v
+-----------------------------------+
|  OTel SDK and collector or agent  |
+-----------------------------------+
                 |
                 v
+---------------------------------------+
|  X-Ray trace and Application Signals  |
+---------------------------------------+
                   |
                   v
+----------------------------------------------------+
|  Correlated service, SLO, log, and fault evidence  |
+----------------------------------------------------+
Trace and signal model, deeply
A trace represents one end-to-end transaction. A span represents one timed operation and carries a trace ID, span ID, parent (for a tree), start/end, status, name and attributes. Resource attributes identify the telemetry-producing service/runtime; span attributes describe the operation. Events add timestamped details. Links connect causally related work when a strict parent/child relationship is wrong, such as producer and later queue consumer.
The caller injects trace context into supported HTTP/message headers; the receiver extracts it and starts a child span. Broken propagation creates separate traces even when every service emits spans. Do not put tokens, passwords, full request bodies, sensitive SQL parameters or unapproved user identity in attributes. Unbounded values also make search and service naming expensive/confusing.
For new code, use upstream OpenTelemetry or AWS Distro for OpenTelemetry instrumentation, then export through the CloudWatch agent, ADOT/OTel collector or supported endpoint to X-Ray/Application Signals. Since February 25, 2026, X-Ray SDKs and daemon receive maintenance/security fixes only; AWS documentation recommends migration to OpenTelemetry. Plan migration before the documented February 25, 2027 end of support for those SDKs/daemon. X-Ray as a trace analysis destination is not the same thing as the maintenance-mode instrumentation libraries.
Application Signals uses collected metrics/traces to present services, operations, dependencies and service-level objectives. An SLO needs an SLI, target, evaluation period and owner - for example, successful requests under a latency threshold - not simply CPU. Trace maps show sampled relationships and faults; they do not prove every request was captured.
Sampling controls volume. Head sampling decides near request start and can miss rare failures; parent-based sampling should keep a trace decision coherent. Record the effective rule, reservoir/rate or probability, upstream decision and collector behavior. Increase sampling only with cost/privacy approval and restore it after the investigation.
Architecture decision table
| Situation | Direction | Reason |
|---|---|---|
| Requirement matches | Use OpenTelemetry or ADOT for new instrumentation and X-Ray or Application Signals as supported analysis destinations. | Select only after scope, behavior, security, recovery, operations, and price evidence agree. |
| Requirement does not match | Avoid starting new code on maintenance-mode X-Ray SDKs or recording secrets and high-cardinality personal data in span attributes. | Rejecting an attractive service is a valid architecture result. |
| No create permission or cost approval | Use supplied evidence and local design work | Learning does not depend on creating an hourly resource. |
| Existing resource is unknown or unowned | Inspect only, then stop | Never change or delete a resource merely because it resembles a course example. |
AWS Management Console, step by step
Sign in with the normal non-root learning identity. Write the expected starting state before opening the service.
- Open CloudWatch > Application Signals > Services in the correct Region. Select a service and compare call volume, fault/error rate and latency for one absolute UTC range.
- Open one operation, one dependency and its SLO. Record service/operation names, SLI query, target, evaluation interval and burn/error-budget evidence.
- Follow a trace from the service map. Draw each span with service, operation, parent/link, duration, status and downstream call; identify the critical path rather than adding every span duration.
- Copy the redacted trace ID into Logs Insights and prove matching application logs. Compare event timestamps with span boundaries.
- Inspect instrumentation library/version, propagator, sampling rule and collector/agent configuration from approved evidence. Record exporter destination and IAM/network path.
- This lesson is read-only. Do not change sampling, enable Application Signals or deploy collectors without cost and workload-owner approval.
CloudShell and AWS CLI, step by step
Start with a known caller and Region:
export AWS_DEFAULT_REGION="ap-south-1"
aws sts get-caller-identity --query Arn --output text
aws configure list
Redact the account part of the ARN in shared evidence. Now run the topic queries:
start="$(date -u -d '1 hour ago' +%Y-%m-%dT%H:%M:%SZ)"
end="$(date -u +%Y-%m-%dT%H:%M:%SZ)"
aws xray get-service-graph --start-time "$start" --end-time "$end" --output json
aws xray get-trace-summaries --start-time "$start" --end-time "$end" --output json
aws cloudwatch list-metrics --namespace ApplicationSignals --output table
Expected interpretation
The graph is reconstructed from sampled traces in the selected window. A missing node can mean no traffic, no sampling, broken propagation, missing instrumentation or exporter failure. A trace summary locates candidate traces; retrieve the batch trace and inspect segment/subsegment documents for the real timeline. Application Signals metrics are aggregate evidence and may exist even when one expected trace was not sampled.
Practical work
Draw a request across API, Lambda, database, and external dependency. Define OTel trace and span IDs, propagation, sampling, collector or CloudWatch agent, redaction, service name, SLO, logs correlation, and missing-span test.
Diagnose this topic from its own evidence
| Symptom | Prove first | Smallest safe correction |
|---|---|---|
| no traces anywhere | SDK auto/manual instrumentation, sampling, collector health, IAM and endpoint | repair first failed export hop |
| one service missing | incoming/outgoing propagation and instrumented framework/client | enable supported instrumentation and preserve W3C context |
| traces split at queue | producer context injection and consumer extraction/link model | propagate message attributes and model async causality |
| service map explodes | unstable service.name/resource attributes or URL values in names | normalize low-cardinality service/operation naming |
| trace says success but user failed | span status/exception mapping and business assertion | record meaningful error/status and correlate logs/SLI |
Positive test: one supplied request produces a connected trace and matching log correlation ID. Negative test: a controlled downstream error marks the responsible span and service signal. Dependency-failure test: collector export is denied while the application still responds; distinguish telemetry loss from workload failure.
Cost and cleanup
Trace recording, Application Signals, custom metrics, logs, collector capacity, and retained telemetry can charge.
Knowledge check
- What operational purpose is this lesson solving?
Expected direction: Instrument new tracing with OpenTelemetry or ADOT, send traces to X-Ray and CloudWatch, and correlate services, spans, metrics, logs, sampling, and service-level objectives.
- Which scope or ownership boundary must be proved first?
Expected direction: For X-Ray, Application Signals, and OpenTelemetry, separate account and Region scope, identity, configuration, data or network behavior, failure ownership, evidence retention, and cleanup.
- What evidence is strong enough to accept the result?
Expected direction: Success requires matching Console, command-line, behavior, monitoring, and owner evidence for X-Ray, Application Signals, and OpenTelemetry. One green status is not enough.
- Which tempting design or shortcut must be rejected?
Expected direction: Avoid starting new code on maintenance-mode X-Ray SDKs or recording secrets and high-cardinality personal data in span attributes.
- Which cost dimensions and retained resources need an owner?
Expected direction: Trace recording, Application Signals, custom metrics, logs, collector capacity, and retained telemetry can charge.
Lesson acceptance
- A trace diagram identifies trace/span IDs, parent/link relationships, critical path, statuses and resource attributes.
- W3C propagation and asynchronous messaging boundaries are explained.
- OpenTelemetry is selected for new instrumentation, with the X-Ray SDK/daemon maintenance and end-of-support dates recorded correctly.
- Connected positive, downstream-error and collector-failure cases are diagnosed from traces, logs, metrics and collector evidence.
- Sampling, SLO, sensitive-data, cardinality, retention and telemetry-cost owners are named.