
AWS 213: Managed Grafana, Prometheus and centralized observability
Why this lesson matters
Prometheus-compatible collection and Grafana visualization can provide one operating view across clusters and accounts without running those control planes yourself. “Managed” does not remove architecture work: collectors still need discovery, relabeling, buffering and IAM; workspaces need tenancy, retention and quotas; Grafana needs human authentication, data-source permissions and alert ownership. Unbounded labels can multiply active series and cost faster than adding hosts.
What you will be able to do
By the end, you can:
- trace scrape or service-discovery targets through collector, remote write, AMP workspace, PromQL and Grafana;
- distinguish metric name, labels, sample, time series, active series and histogram cardinality;
- design account/cluster/tenant labels without request IDs, pod UIDs or other unbounded values;
- separate Grafana user roles, folder/dashboard permissions, data-source query permission and AWS IAM roles;
- choose service-managed or customer-managed data-source permissions and verify cross-account trust;
- calculate ingestion, storage, query and collector cost drivers from interval and series count;
- diagnose missing targets, remote-write rejection, empty PromQL and dashboard access failures.
Before you start
- Use a personal AWS account only when its owner has approved the lesson. Do not use the root user for daily work.
- CloudShell is the default command environment. AWS028 explains CloudShell; AWS029 and AWS030 explain local AWS CLI installation and profiles.
- The course example Region is
ap-south-1. Global services and services with a required control Region are called out in their commands. - Run
aws sts get-caller-identityprivately. Redact the account number before sharing evidence. - Never paste access keys, passwords, secret values, private object data, presigned URLs, or full account-specific ARNs into a submission.
- This is a no-create lesson. Every Console action and AWS CLI command is read-only. Create the practical artifact locally.
- Console wording can change. Use the Console service search if a menu label has moved, then confirm the current field in the official documentation.
The core model
| Question | What it means in this lesson |
|---|---|
| Purpose | Centralize dashboards and Prometheus-compatible metrics while controlling workspace identity, data-source permissions, ingestion, cardinality, retention, alerting, and tenant boundaries. |
| Scope and boundary | For Amazon Managed Grafana and Amazon Managed Service for Prometheus, separate account and Region scope, identity, configuration, data or network behavior, failure ownership, evidence retention, and cleanup. |
| Evidence of success | Success requires matching Console, command-line, behavior, monitoring, and owner evidence for Amazon Managed Grafana and Amazon Managed Service for Prometheus. One green status is not enough. |
| Cost model | Prometheus ingestion, storage and query samples, Grafana active users or licensing dimensions, network transfer, collectors, and logs can charge. |
| Safe rejection rule | Avoid uncontrolled high-cardinality labels, broad cross-account roles, or a dashboard without data ownership and alert response. |
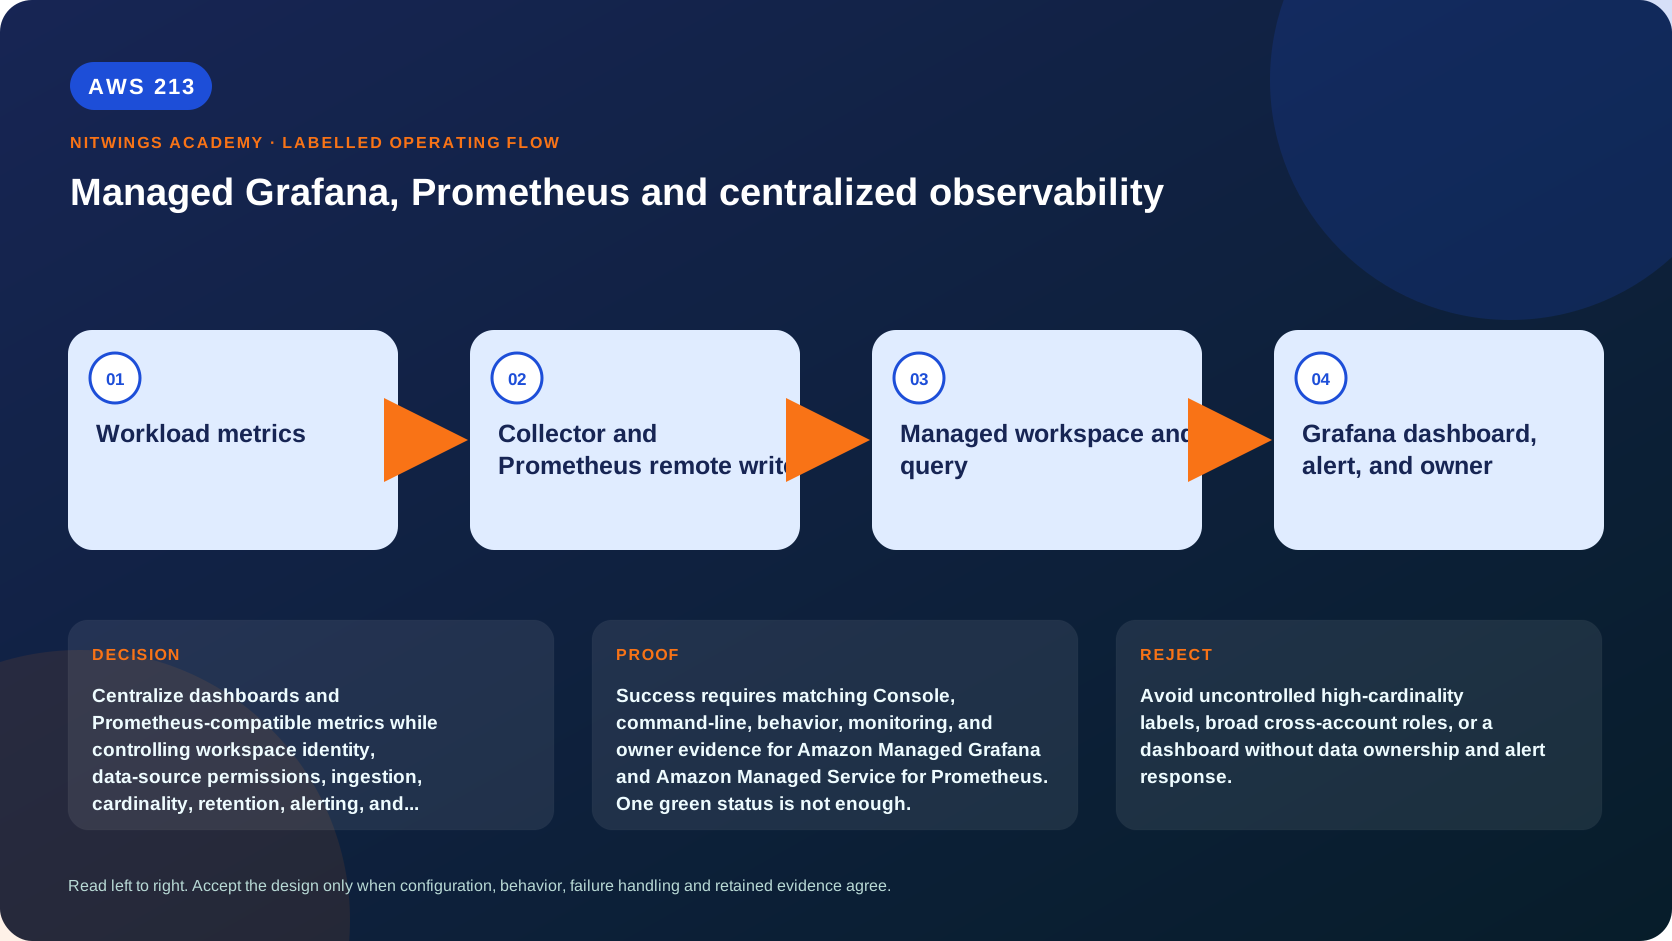
How the request flows
+----------------------+
|   Workload metrics   |
+----------------------+
           |
           v
+-----------------------------------------+
|  Collector and Prometheus remote write  |
+-----------------------------------------+
                    |
                    v
+-------------------------------+
|  Managed workspace and query  |
+-------------------------------+
               |
               v
+---------------------------------------+
|  Grafana dashboard, alert, and owner  |
+---------------------------------------+
Prometheus data path and cardinality
A Prometheus sample is a metric name, complete label set, timestamp and value. Every unique metric-name/label-set combination is a separate time series. If http_requests_total has 5 methods × 8 statuses × 20 services × 3 environments, it can produce 2,400 series before instance, cluster or route labels. Adding one label with 100,000 user IDs can multiply that design catastrophically. Keep bounded identity labels such as environment, service, operation and status class; put request/user IDs in logs or traces.
The data path is:
instrumented target or exporter
  -> service discovery and scrape
  -> collector relabel/drop/aggregate and queue
  -> SigV4-authenticated remote write
  -> Amazon Managed Service for Prometheus workspace
  -> PromQL query/rule
  -> Amazon Managed Grafana data source, panel and alert
  -> notification owner and runbook
Amazon Managed Service for Prometheus (AMP) supplies managed ingestion, storage and PromQL-compatible querying. Workspace retention defaults to 150 days and can currently be configured up to 1,095 days. A longer retention is not automatically useful: it increases stored data and may encourage expensive broad queries. The managed collector or self-managed/ADOT collector still needs target discovery, network path, queue/WAL or retry behavior, a least-privilege remote-write role and monitoring of itself.
PromQL labels and operators matter. A rate should use a counter and a range long enough for the scrape interval; aggregate with sum by (...) only after deciding which labels define the service boundary. Joining vectors with mismatched labels can silently return no series or multiply results. Dashboards must show query, interval, source workspace and units - not only a polished graph.
Grafana identity and data boundaries
Amazon Managed Grafana supports IAM Identity Center or SAML for human authentication. Workspace roles are Admin, Editor and Viewer, but those roles do not by themselves limit every data-source query. By default, workspace users may be able to query a configured data source; enable and test data-source permissions where tenant separation requires it. Folder/dashboard permissions control content visibility/editing and are another layer.
For AWS data sources, service-managed permission modes can create roles/policies for the account or organization; customer-managed mode uses an explicitly supplied role trusted by grafana.amazonaws.com. Cross-account organization setup can create member roles through StackSets. Review exact selected OUs/accounts, role trust, data-source actions/resources and external/confused-deputy conditions. Avoid hosting shared operational resources in the Organizations management account.
Architecture decision table
| Situation | Direction | Reason |
|---|---|---|
| Requirement matches | Use managed workspaces when Prometheus and Grafana compatibility plus reduced control-plane operations match the organization. | Select only after scope, behavior, security, recovery, operations, and price evidence agree. |
| Requirement does not match | Avoid uncontrolled high-cardinality labels, broad cross-account roles, or a dashboard without data ownership and alert response. | Rejecting an attractive service is a valid architecture result. |
| No create permission or cost approval | Use supplied evidence and local design work | Learning does not depend on creating an hourly resource. |
| Existing resource is unknown or unowned | Inspect only, then stop | Never change or delete a resource merely because it resembles a course example. |
AWS Management Console, step by step
Sign in with the normal non-root learning identity. Write the expected starting state before opening the service.
- Open Amazon Managed Service for Prometheus > Workspaces in the approved Region. Record alias/ID, status, endpoint, retention, tags, logging and policy configuration.
- Inspect collector or remote-write evidence: discovered target, last scrape, sample rate, queue/retry/drop metrics, role and endpoint/network path. Do not assume workspace
ACTIVEmeans data is arriving. - Open Amazon Managed Grafana > Workspaces. Record authentication provider, Grafana version, network access, permission mode, workspace role and data-source role.
- In the Grafana workspace, inspect one AMP data source and its permissions. As an approved Viewer test identity, prove which query and folder/dashboard access succeeds and which tenant data is denied.
- Open one panel's query inspector. Record PromQL, workspace, time range, step, returned series, labels, samples and units; compare with a direct approved query.
- Inspect one alert rule through evaluation, notification policy/contact point and runbook owner. This no-create track must not save dashboards, test contact points or change workspace access.
CloudShell and AWS CLI, step by step
Start with a known caller and Region:
export AWS_DEFAULT_REGION="ap-south-1"
aws sts get-caller-identity --query Arn --output text
aws configure list
Redact the account part of the ARN in shared evidence. Now run the topic queries:
aws grafana list-workspaces --query 'workspaces[].{Name:name,Status:status,Auth:authentication.providers,Endpoint:endpoint}' --output table
aws amp list-workspaces --query 'workspaces[].{Alias:alias,Status:status.status,Arn:arn}' --output table
aws amp describe-workspace --workspace-id replace-with-approved-workspace-id --output json
aws grafana describe-workspace --workspace-id replace-with-approved-grafana-workspace-id \
  --query 'workspace.{Name:name,Status:status,Version:grafanaVersion,Auth:authentication,PermissionType:permissionType,Role:roleArn,Network:networkAccessControl}' --output json
Expected interpretation
Workspace ACTIVE proves the managed control plane is available; it does not prove targets are scraped, remote write is accepted, a query returns current samples, Grafana can assume the data-source role, or the right users can view only authorized tenants. Correlate target/collector metrics, workspace ingestion, direct PromQL, Grafana query inspector and user authorization.
Practical work
Design central observability for three accounts and two clusters. Define collectors, remote write, labels, tenancy, IAM roles, Grafana authentication, data sources, dashboards, alerts, cardinality limits, retention, and cost ownership.
Diagnose this topic from its own evidence
| Symptom | Inspect in order | Smallest safe correction |
|---|---|---|
| target absent | discovery labels/selectors, scrape config, DNS/TLS/SG and target /metrics | fix discovery/path for one approved target |
| scrape succeeds but AMP empty | relabel drop, remote-write queue, SigV4 role, endpoint/Region, throttling | repair failed collector-to-workspace hop |
| PromQL returns nothing | time range, metric name, label matcher, scrape interval and vector matching | broaden one matcher, inspect labels, then restore bounded query |
| Grafana panel errors | workspace status, data-source URL/Region, role trust/actions and data-source permission | narrow IAM/permission repair; do not grant Admin broadly |
| cost or limits spike | active-series growth, high-cardinality label, scrape interval, histogram buckets, broad queries | drop/normalize offending labels and validate required signal remains |
Positive test: one bounded service metric is scraped, remotely written, directly queried and shown in Grafana with matching value/time. Negative test: a tenant-scoped viewer cannot query another tenant's source. Dependency-failure test: break only supplied collector permission evidence and show why workspace/Grafana health can remain green while fresh samples stop.
Cost and cleanup
AMP charges are driven by samples ingested, compressed samples/metadata stored, query samples processed and - when used - managed collector hours/samples. Native-histogram populated buckets have metering implications. Amazon Managed Grafana pricing depends on current workspace/user/licensing dimensions; collectors, compute, VPC networking, cross-account/Region transfer, logs, alerts and notification targets are separate. Estimate active series × samples per minute × minutes, then add label growth, histogram buckets, retention and dashboard/query frequency. Cleanup includes only owned workspaces, collectors, roles/StackSets, data sources, dashboards, alert rules, contact points, logs and endpoints after evidence export and dependency checks.
Knowledge check
- What operational purpose is this lesson solving?
Expected direction: Centralize dashboards and Prometheus-compatible metrics while controlling workspace identity, data-source permissions, ingestion, cardinality, retention, alerting, and tenant boundaries.
- Which scope or ownership boundary must be proved first?
Expected direction: For Amazon Managed Grafana and Amazon Managed Service for Prometheus, separate account and Region scope, identity, configuration, data or network behavior, failure ownership, evidence retention, and cleanup.
- What evidence is strong enough to accept the result?
Expected direction: Success requires matching Console, command-line, behavior, monitoring, and owner evidence for Amazon Managed Grafana and Amazon Managed Service for Prometheus. One green status is not enough.
- Which tempting design or shortcut must be rejected?
Expected direction: Avoid uncontrolled high-cardinality labels, broad cross-account roles, or a dashboard without data ownership and alert response.
- Which cost dimensions and retained resources need an owner?
Expected direction: Prometheus ingestion, storage and query samples, Grafana active users or licensing dimensions, network transfer, collectors, and logs can charge.
Lesson acceptance
- A three-account/two-cluster diagram shows discovery, collectors, remote write, AMP tenancy, Grafana roles/data sources and alert ownership.
- Cardinality is calculated from a real label set, and every unbounded label is removed or justified outside metrics.
- One metric is proved from target through collector, workspace query and Grafana panel with matching UTC evidence.
- Viewer/data-source negative authorization and collector-dependency failure are diagnosed without broadening roles.
- Retention, ingestion/query/storage/collector cost, quotas, cross-account trust and complete cleanup have named owners.