
AWS 214: Install and manage the CloudWatch Agent on EC2
Why this lesson matters
EC2 default metrics describe the hypervisor-visible instance, not guest memory usage, filesystem utilization or application files. The unified CloudWatch agent can collect metrics, logs and traces from inside the operating system, but only when package, configuration, local permissions, credentials, Region and network delivery all agree. This lab builds that chain without opening SSH and proves actual datapoints rather than an installed package.
What you will be able to do
By the end, you can:
- deploy the supplied P10 baseline with no inbound administration port and IMDSv2 required;
- install the signed AWS-managed CloudWatch agent package through Systems Manager Distributor;
- fetch an exact Parameter Store configuration and explain every metric/log field;
- prove agent process state, validation logs, recent metric datapoints and structured log delivery;
- distinguish EC2 service metrics from guest metrics in the custom namespace;
- restart the agent and measure any publication gap with a changed marker;
- delete the complete stack and reconcile telemetry, compute, network and IAM residuals.
Before you start
- Use a personal AWS account only when its owner has approved the lesson. Do not use the root user for daily work.
- CloudShell is the default command environment. AWS028 explains CloudShell; AWS029 and AWS030 explain local AWS CLI installation and profiles.
- The course example Region is
ap-south-1. Global services and services with a required control Region are called out in their commands. - Run
aws sts get-caller-identityprivately. Redact the account number before sharing evidence. - Never paste access keys, passwords, secret values, private object data, presigned URLs, or full account-specific ARNs into a submission.
- This lesson has an optional live path. Check current prices, obtain the account owner's approval, set a hard timer, use course tags, and complete the stated cleanup. The evidence path is a complete alternative.
- Console wording can change. Use the Console service search if a menu label has moved, then confirm the current field in the official documentation.
The core model
| Question | What it means in this lesson |
|---|---|
| Purpose | Install from an approved package source, configure metrics and logs, use an instance role, verify agent state, and remove temporary telemetry and compute. |
| Scope and boundary | For CloudWatch Agent on EC2, separate account and Region scope, identity, configuration, data or network behavior, failure ownership, evidence retention, and cleanup. |
| Evidence of success | Success requires matching Console, command-line, behavior, monitoring, and owner evidence for CloudWatch Agent on EC2. One green status is not enough. |
| Cost model | Requests, running capacity, stored telemetry, retained history, data transfer, and connected resources must be priced for the exact design. |
| Safe rejection rule | Avoid access keys on the instance, collecting secrets, wildcard log paths, infinite retention, or leaving the training instance running. |
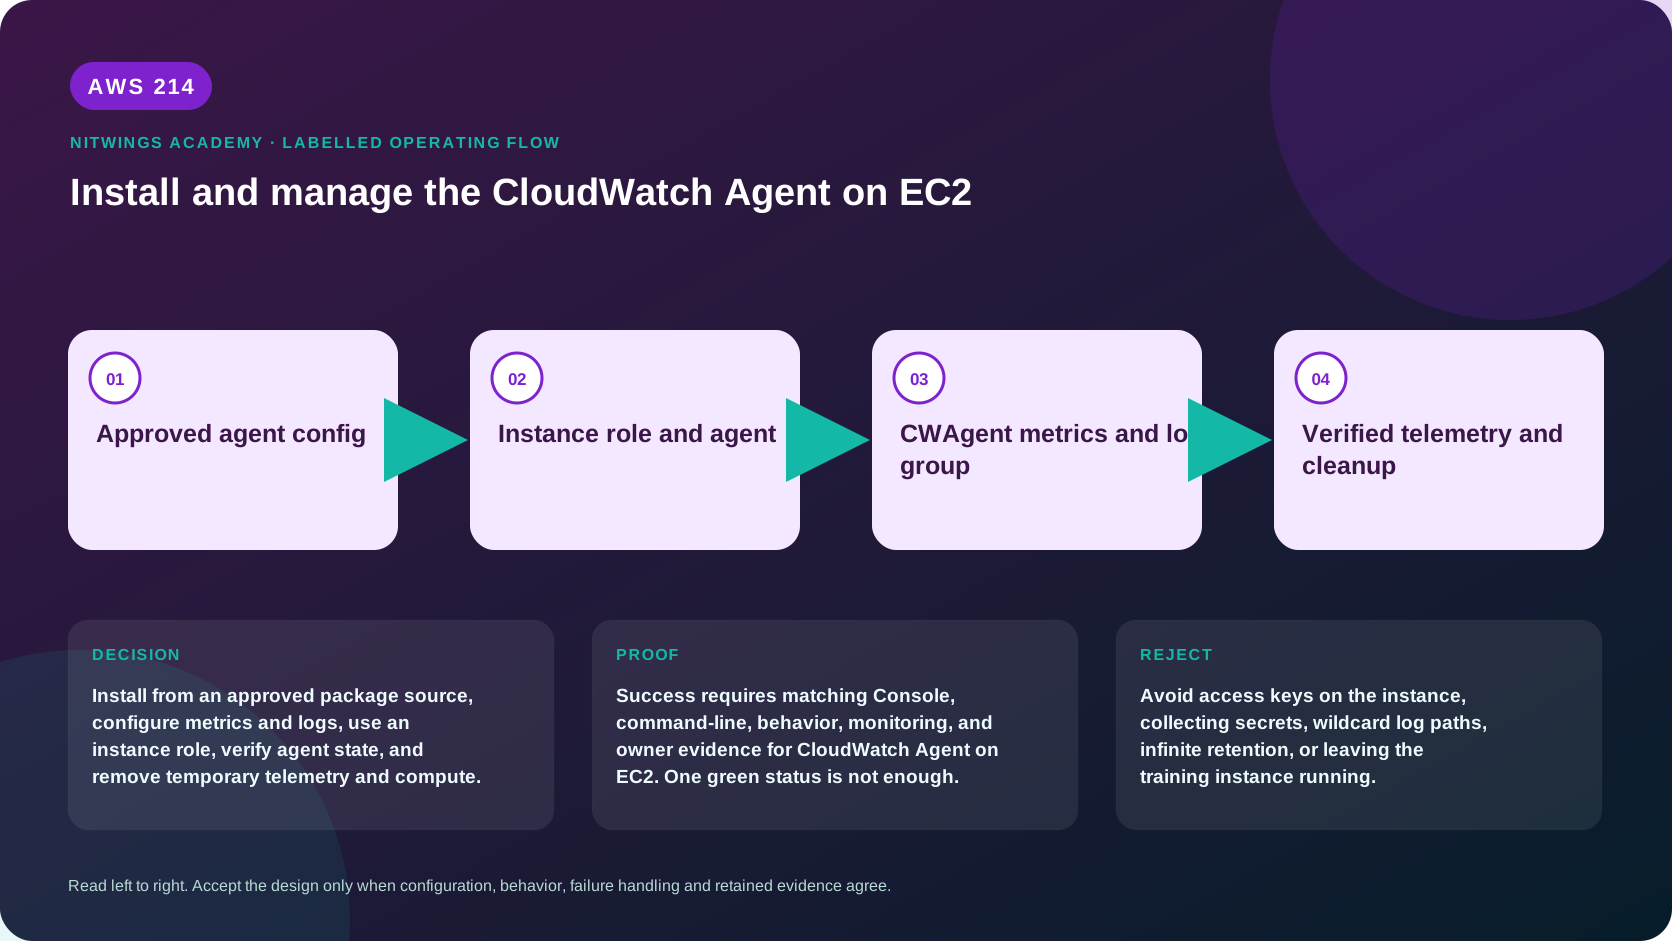
How the request flows
+-------------------------+
|  Approved agent config  |
+-------------------------+
            |
            v
+---------------------------+
|  Instance role and agent  |
+---------------------------+
             |
             v
+---------------------------------+
|  CWAgent metrics and log group  |
+---------------------------------+
                |
                v
+----------------------------------+
|  Verified telemetry and cleanup  |
+----------------------------------+
What the supplied configuration does
The P10 template creates one AL2023 managed node, a VPC/public subnet, an egress-only-from-the-SG administration path, two seven-day log groups and /nw/p10/agent-config. The instance has a public IPv4 address only for outbound access; its security group has no inbound rules. Systems Manager is the control path.
The agent configuration publishes at 60-second intervals:
| Input | CloudWatch destination | Identity/cost implication |
|---|---|---|
guest memory mem_used_percent | custom namespace NitWings/P10 | one custom series per complete dimension set |
root filesystem disk_used_percent | NitWings/P10 | mount/path/device choices can multiply series |
/var/log/nw-p10-app.log | /nw/p10/app, stream {instance_id} | ingestion, seven-day storage and query costs |
| agent's own log | /nw/p10/agent, stream {instance_id} | proves exporter behavior but must avoid recursive collection |
The CloudWatch agent runs as root in this isolated lab so it can read both files. Production should use the least-privileged service user and exact file/directory read/execute permissions. The instance role - not access keys - supplies rotating credentials. CloudWatchAgentServerPolicy and AmazonSSMManagedInstanceCore simplify the lab; production policy reduction is a required architecture finding.
fetch-config validates, translates and starts a complete configuration. append-config merges another uniquely named configuration and can create duplicate collection when ownership is unclear. Every configuration change requires a controlled restart/reload and post-change datapoint test.
Architecture decision table
| Situation | Direction | Reason |
|---|---|---|
| Requirement matches | Use the agent for guest OS metrics, logs, traces, and supported telemetry not supplied by default service metrics. | Select only after scope, behavior, security, recovery, operations, and price evidence agree. |
| Requirement does not match | Avoid access keys on the instance, collecting secrets, wildcard log paths, infinite retention, or leaving the training instance running. | Rejecting an attractive service is a valid architecture result. |
| No create permission or cost approval | Use supplied evidence and local design work | Learning does not depend on creating an hourly resource. |
| Existing resource is unknown or unowned | Inspect only, then stop | Never change or delete a resource merely because it resembles a course example. |
AWS Management Console, step by step
Sign in with the normal non-root learning identity. Write the expected starting state before opening the service.
- Deploy only after completing the runbook's authority/cost gate. In Systems Manager > Fleet Manager, wait for
nw-p10-managed-nodeto beOnline; EC2runningis not enough. - In Run Command, inspect the
AWS-ConfigureAWSPackageinstallation andAmazonCloudWatch-ManageAgentconfiguration command IDs, target count, status, response code, stdout and stderr. - In Parameter Store, read
/nw/p10/agent-config; verify exact namespace, 60-second interval, dimensions, file paths, stream variables and destination groups. Do not edit it in place. - In CloudWatch > Metrics, choose
NitWings/P10and the exact instance dimensions. Set a 15-minute absolute UTC range and comparemem_used_percentanddisk_used_percent. - In Logs, locate
p10-positivein/nw/p10/app; compare event and ingestion times. Inspect/nw/p10/agentfor validation/export errors. - After restart, prove a new marker and datapoint. Export redacted evidence, then execute stack cleanup and zero-residual inventory.
CloudShell and AWS CLI, step by step
Start with a known caller and Region:
export AWS_DEFAULT_REGION="ap-south-1"
aws sts get-caller-identity --query Arn --output text
aws configure list
Redact the account part of the ARN in shared evidence. Now run the topic queries:
aws ssm describe-instance-information --query 'InstanceInformationList[].{Id:InstanceId,Ping:PingStatus,Agent:AgentVersion}' --output table
aws ssm send-command --instance-ids replace-with-instance-id --document-name AWS-ConfigureAWSPackage --parameters action=Install,name=AmazonCloudWatchAgent --query 'Command.CommandId' --output text
aws cloudwatch list-metrics --namespace NitWings/P10 --output table
aws logs describe-log-groups --log-group-name-prefix /nw/p10/ --output table
Expected interpretation
Installation success proves only package installation. Agent status proves a local process and loaded configuration. list-metrics proves a series was discoverable, but only get-metric-statistics/get-metric-data proves recent values. Log-group existence proves neither stream freshness nor correct content. Pass only when command, process, metric and log evidence share the expected instance and UTC window.
Practical work
Follow the complete P10 deployment, verification, restart and cleanup runbook. Preserve stack/template hash, command IDs and redacted outputs. If live cost/permission is not approved, use instructor-supplied outputs from the same template revision and label the track; do not claim execution.
Live agent lab
Use only the stack output instance. Do not open SSH, substitute an unknown node or collect wildcard paths. Run the supplied commands in order: deploy, prove SSM online, install, configure, write harmless structured marker, prove NitWings/P10 datapoints and both log streams, restart, changed retest, then delete. The namespace is intentionally NitWings/P10, not the agent default CWAgent, because the supplied configuration owns it explicitly.
Diagnose this topic from its own evidence
| Symptom | Check in order | Correction |
|---|---|---|
| node never appears in SSM | instance state, SSM Agent, role, IMDSv2, DNS/route/443 | repair first failed managed-node dependency |
| package command fails | SSM Agent version, platform, Distributor package access, disk and command stderr | repair exact prerequisite; do not curl an unverified binary |
| agent will not start | configuration-validation.log, JSON/schema, file permissions and Region | correct reviewed config and run fetch-config again |
| metrics missing but logs arrive | namespace/name/dimensions, metric IAM, interval and agent log | query exact series and repair metric output only |
| logs missing but metrics arrive | file path/read permission, stream/group IAM, timestamp and offset | fix exact file/log output without widening wildcard collection |
Positive test: fresh metrics and p10-positive log marker arrive. Negative test: querying a fake instance dimension returns no datapoints. Dependency-failure test: supplied evidence denies only logs:PutLogEvents; metrics continue while agent logs show log delivery failure. Recovery must restore the original policy and changed marker.
Cost and cleanup
Price the instance runtime, EBS, public IPv4, two custom metrics and their API retrieval, log ingestion/storage/querying, Parameter Store tier, Run Command output and any retained S3/CloudWatch Logs destination. The template creates no NAT gateway or interface endpoints. Cleanup must prove removal of stack, instance, ENI/public IP, volume, SG/VPC path, role/profile, parameter and both log groups; review delayed billing afterward.
Knowledge check
- What operational purpose is this lesson solving?
Expected direction: Install from an approved package source, configure metrics and logs, use an instance role, verify agent state, and remove temporary telemetry and compute.
- Which scope or ownership boundary must be proved first?
Expected direction: For CloudWatch Agent on EC2, separate account and Region scope, identity, configuration, data or network behavior, failure ownership, evidence retention, and cleanup.
- What evidence is strong enough to accept the result?
Expected direction: Success requires matching Console, command-line, behavior, monitoring, and owner evidence for CloudWatch Agent on EC2. One green status is not enough.
- Which tempting design or shortcut must be rejected?
Expected direction: Avoid access keys on the instance, collecting secrets, wildcard log paths, infinite retention, or leaving the training instance running.
- Which cost dimensions and retained resources need an owner?
Expected direction: Requests, running capacity, stored telemetry, retained history, data transfer, and connected resources must be priced for the exact design.
Lesson acceptance
- Supplied template and runbook hashes identify the exact lab revision.
- The managed node is online without an inbound SG rule or SSH key workflow.
- Install/configure commands have successful per-node response codes and no unexplained stderr.
- Agent status/version, validation log, two recent custom metrics and both log groups agree by instance/time.
- Restart has before/after datapoints and a changed request marker; any gap is measured.
- Stack deletion and exact inventory prove zero P10 residuals, with delayed billing review assigned.