
AWS 215: Publish custom metrics and structured application logs
Why this lesson matters
An application metric answers a bounded numerical question quickly; a structured log explains individual events. Publishing the same high-cardinality identity into both is wasteful and dangerous. This lab emits five fake order outcomes as one low-cardinality metric series and five JSON events with correlation IDs, then proves aggregate and event-detail views agree over the same UTC window.
What you will be able to do
By the end, you can:
- define a metric contract with namespace, name, stable dimensions, unit, cadence and missing-data meaning;
- publish five timestamped points without using correlation IDs as metric dimensions;
- write five one-line JSON events with UTC time, level, service, event, outcome and fake request ID;
- prove custom metric aggregation and individual logs over one matching interval;
- distinguish event time, ingestion time and metric timestamp;
- test wrong-dimension and wrong-correlation queries as expected negative results;
- stop publication, preserve evidence and either retain the approved P10 stack for AWS216 or clean it completely.
Before you start
- Use a personal AWS account only when its owner has approved the lesson. Do not use the root user for daily work.
- CloudShell is the default command environment. AWS028 explains CloudShell; AWS029 and AWS030 explain local AWS CLI installation and profiles.
- The course example Region is
ap-south-1. Global services and services with a required control Region are called out in their commands. - Run
aws sts get-caller-identityprivately. Redact the account number before sharing evidence. - Never paste access keys, passwords, secret values, private object data, presigned URLs, or full account-specific ARNs into a submission.
- This lesson has an optional live path. Check current prices, obtain the account owner's approval, set a hard timer, use course tags, and complete the stated cleanup. The evidence path is a complete alternative.
- Console wording can change. Use the Console service search if a menu label has moved, then confirm the current field in the official documentation.
The core model
| Question | What it means in this lesson |
|---|---|
| Purpose | Publish a bounded custom metric and JSON application events with stable dimensions, UTC timestamps, units, retention, correlation IDs, and no secrets. |
| Scope and boundary | For custom metrics and structured logs, separate account and Region scope, identity, configuration, data or network behavior, failure ownership, evidence retention, and cleanup. |
| Evidence of success | Success requires matching Console, command-line, behavior, monitoring, and owner evidence for custom metrics and structured logs. One green status is not enough. |
| Cost model | Requests, running capacity, stored telemetry, retained history, data transfer, and connected resources must be priced for the exact design. |
| Safe rejection rule | Avoid user IDs as metric dimensions, future timestamps, mixed units, secret fields, or unbounded unique labels. |
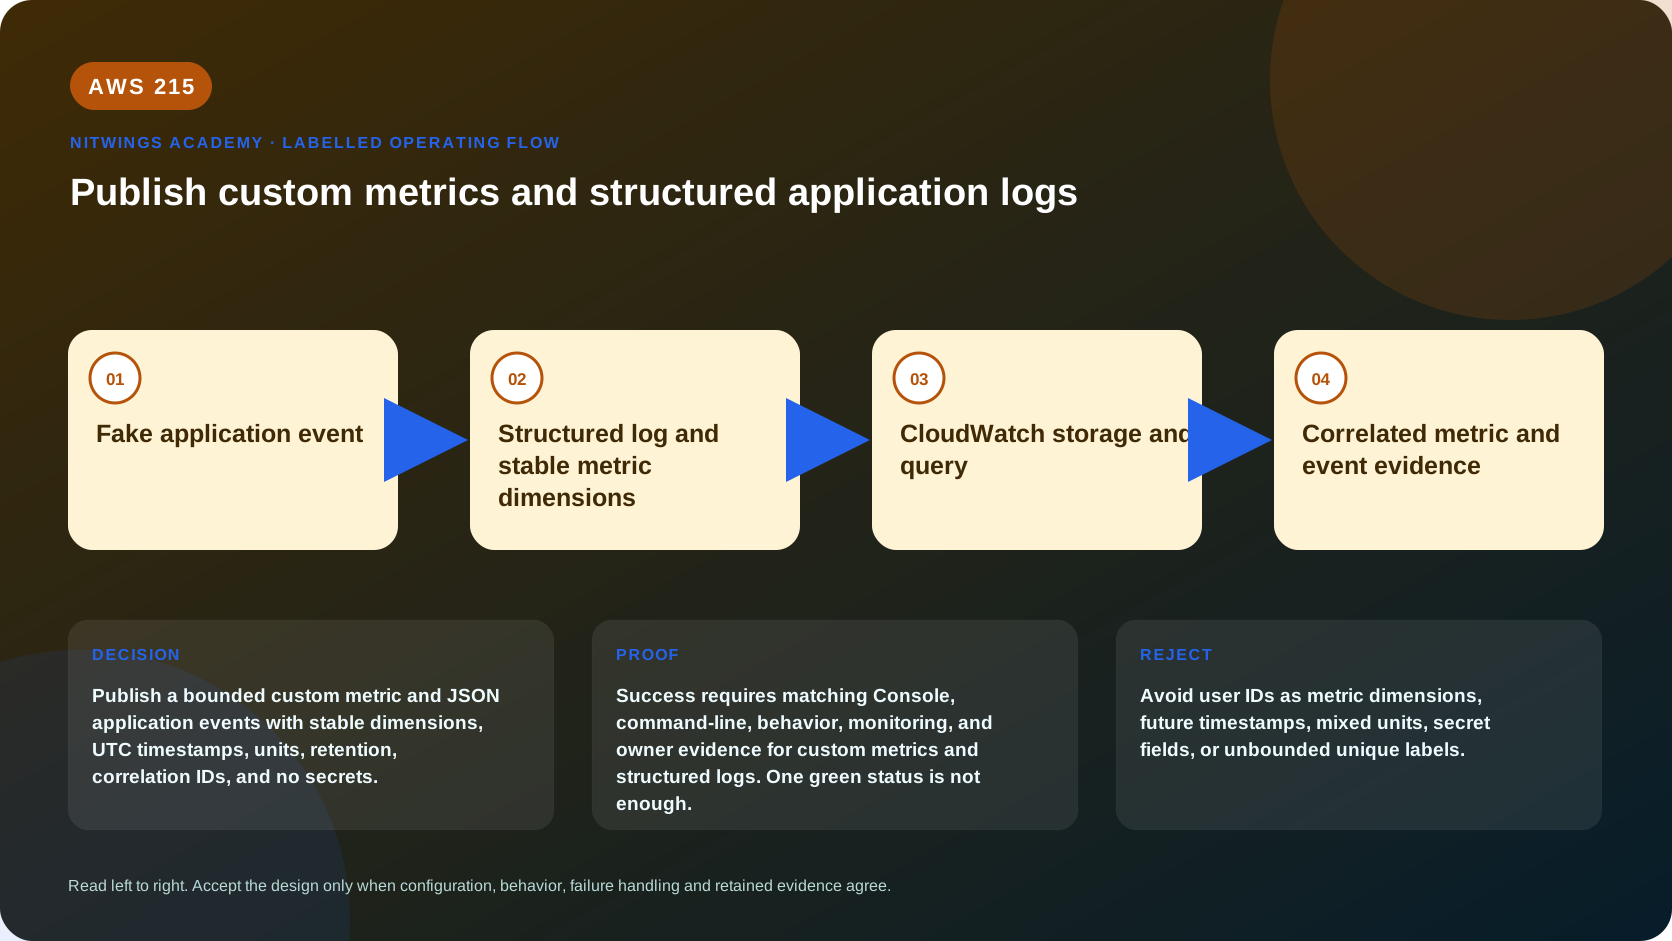
How the request flows
+--------------------------+
|  Fake application event  |
+--------------------------+
             |
             v
+-----------------------------------------------+
|  Structured log and stable metric dimensions  |
+-----------------------------------------------+
                       |
                       v
+--------------------------------+
|  CloudWatch storage and query  |
+--------------------------------+
                |
                v
+----------------------------------------+
|  Correlated metric and event evidence  |
+----------------------------------------+
Metric and log contracts
The metric is NitWings/P10 / OrdersValidated / Environment=lab / Count. Each point is 1 for validated or 0 for rejected. Sum therefore counts successful validations, SampleCount counts attempts, and Sum/SampleCount × 100 calculates the success percentage for periods containing points. Absence means no published observation, not automatically zero attempts.
The corresponding log schema is:
| Field | Meaning | Cardinality/privacy rule |
|---|---|---|
timestamp | producer UTC event time | reject future/invalid time |
level | INFO or WARN | bounded enum |
service | p10-demo | stable deployment identity |
event | order_validation | stable operation |
outcome | validated or rejected | bounded enum |
duration_ms | fake processing duration | numeric; unit in field name |
request_id | p10-order-001…005 | logs only; fake; never a metric dimension |
Do not log customer names, email, addresses, tokens, payment data or request bodies. A correlation ID connects event detail; bounded metric dimensions support aggregation. Every extra dimension value creates another metric time series and billing/cardinality surface.
Architecture decision table
| Situation | Direction | Reason |
|---|---|---|
| Requirement matches | Use custom telemetry for a business or application signal not available from AWS service metrics. | Select only after scope, behavior, security, recovery, operations, and price evidence agree. |
| Requirement does not match | Avoid user IDs as metric dimensions, future timestamps, mixed units, secret fields, or unbounded unique labels. | Rejecting an attractive service is a valid architecture result. |
| No create permission or cost approval | Use supplied evidence and local design work | Learning does not depend on creating an hourly resource. |
| Existing resource is unknown or unowned | Inspect only, then stop | Never change or delete a resource merely because it resembles a course example. |
AWS Management Console, step by step
Sign in with the normal non-root learning identity. Write the expected starting state before opening the service.
- Deploy/start P10 from the runbook, or continue only while the same approved stack timer is active.
- After publishing, open CloudWatch > Metrics > All metrics > NitWings/P10. Select only
OrdersValidatedwithEnvironment=lab; compare Sum, SampleCount and Average over a one-minute period. - Open
/nw/p10/appin Logs Insights over the identical absolute UTC interval. Parse/filterevent="order_validation", sort by timestamp and count by outcome. - Locate
p10-order-003and prove its rejection detail. Search a fakep10-order-999and record expected zero matches. - Query the metric with
Environment=wrongand record expected no datapoints. Restore the correct dimension without republishing. - Compare metric timestamps, log event times and ingestion times. Explain propagation delay instead of generating duplicate data.
CloudShell and AWS CLI, step by step
Start with a known caller and Region:
export AWS_DEFAULT_REGION="ap-south-1"
aws sts get-caller-identity --query Arn --output text
aws configure list
Redact the account part of the ARN in shared evidence. Now run the topic queries:
stack_name="nw-p10-observability"
instance_id="$(aws cloudformation describe-stacks --stack-name "$stack_name" --query 'Stacks[0].Outputs[?OutputKey==`ManagedNodeId`].OutputValue' --output text)"

for value in 1 1 0 1 1; do
  aws cloudwatch put-metric-data --namespace NitWings/P10 \
    --metric-data "MetricName=OrdersValidated,Dimensions=[{Name=Environment,Value=lab}],Value=${value},Unit=Count"
  sleep 60
done

log_command="$(aws ssm send-command --instance-ids "$instance_id" \
  --document-name AWS-RunShellScript \
  --parameters 'commands=["sudo /usr/local/bin/nw-p10-publish-order-events"]' \
  --query 'Command.CommandId' --output text)"
aws ssm wait command-executed --command-id "$log_command" --instance-id "$instance_id"
aws ssm get-command-invocation --command-id "$log_command" --instance-id "$instance_id" --output json
Expected interpretation
The five points and five events each span about five minutes because both publishers wait between observations. CloudWatch assigns metric timestamps at receipt; the stack-provided log helper generates each event timestamp in UTC. The metric should yield Sum 4 and SampleCount 5 across the full interval. Logs should yield four validated, one rejected and five distinct fake request IDs. The two loops do not start at exactly the same second, so use an absolute UTC query window covering both. Different arrival delay is expected; missing or duplicated business counts are not.
Practical work
Publish the five bounded points and corresponding JSON events against the P10 stack. Query both views over one absolute UTC window, calculate the success ratio, perform the two negative queries, and explain any propagation delay.
Live custom-telemetry lab
Use only namespace NitWings/P10, dimension Environment=lab, existing stack log group /nw/p10/app, and the five fake IDs. Do not create a per-request metric dimension. Custom metric datapoints cannot be manually deleted; stopping the publisher is cleanup and the data ages out under CloudWatch retention. Keep P10 only if AWS216 starts immediately under the same approval/timer; otherwise run full stack cleanup and redeploy later.
Diagnose this topic from its own evidence
| Symptom | Prove | Correction |
|---|---|---|
| metric listed but no recent values | UTC window, exact dimension, publication response and statistic | query exact series/window; republish only one changed test point if approved |
| Sum differs from logs | sample window boundaries, duplicate/missing publications and event outcomes | align UTC interval and reconcile each expected attempt |
| JSON fields not discovered | one-line valid JSON, ingestion completion and field names/types | validate producer output and query raw @message |
| event time is implausible | producer clock/timezone versus ingestion time | correct UTC generation; preserve bad event as evidence |
| series/cardinality grows | dimension names/values and publisher version | stop publisher; remove unbounded dimensions before changed retest |
Positive test: Sum=4, SampleCount=5 and logs show the same outcomes. Negative tests: wrong metric dimension and unknown request ID produce no result. Dependency-failure test: agent is stopped after local events are appended; metric API points arrive while logs do not, proving two independent publication paths.
Cost and cleanup
Price the custom metric time series, PutMetricData requests where applicable, metric retrieval, log ingestion/storage/query scans and the retained P10 infrastructure. A unique request-ID dimension would turn five events into five metric series and must be rejected. Cleanup stops the metric publisher and either retains the whole owned stack briefly for AWS216 or deletes it using the P10 ledger; do not delete shared log groups.
Knowledge check
- What operational purpose is this lesson solving?
Expected direction: Publish a bounded custom metric and JSON application events with stable dimensions, UTC timestamps, units, retention, correlation IDs, and no secrets.
- Which scope or ownership boundary must be proved first?
Expected direction: For custom metrics and structured logs, separate account and Region scope, identity, configuration, data or network behavior, failure ownership, evidence retention, and cleanup.
- What evidence is strong enough to accept the result?
Expected direction: Success requires matching Console, command-line, behavior, monitoring, and owner evidence for custom metrics and structured logs. One green status is not enough.
- Which tempting design or shortcut must be rejected?
Expected direction: Avoid user IDs as metric dimensions, future timestamps, mixed units, secret fields, or unbounded unique labels.
- Which cost dimensions and retained resources need an owner?
Expected direction: Requests, running capacity, stored telemetry, retained history, data transfer, and connected resources must be priced for the exact design.
Lesson acceptance
- Metric and log schemas are documented with allowed fields/values, units, cadence, missing-data meaning and privacy owner.
- Exactly five metric points and five valid one-line JSON events are produced with four successes and one rejection.
- Metric Sum/SampleCount and log outcome counts agree over the same absolute UTC window.
- Wrong-dimension and unknown-correlation negative tests return no data for the expected reason.
- Publication delay, cost/cardinality and retained-metric behavior are explained; P10 is either explicitly retained under timer or fully deleted.