
AWS 216: Build metric filters, composite alarms, anomaly detection, dashboards, and SNS actions
Why this lesson matters
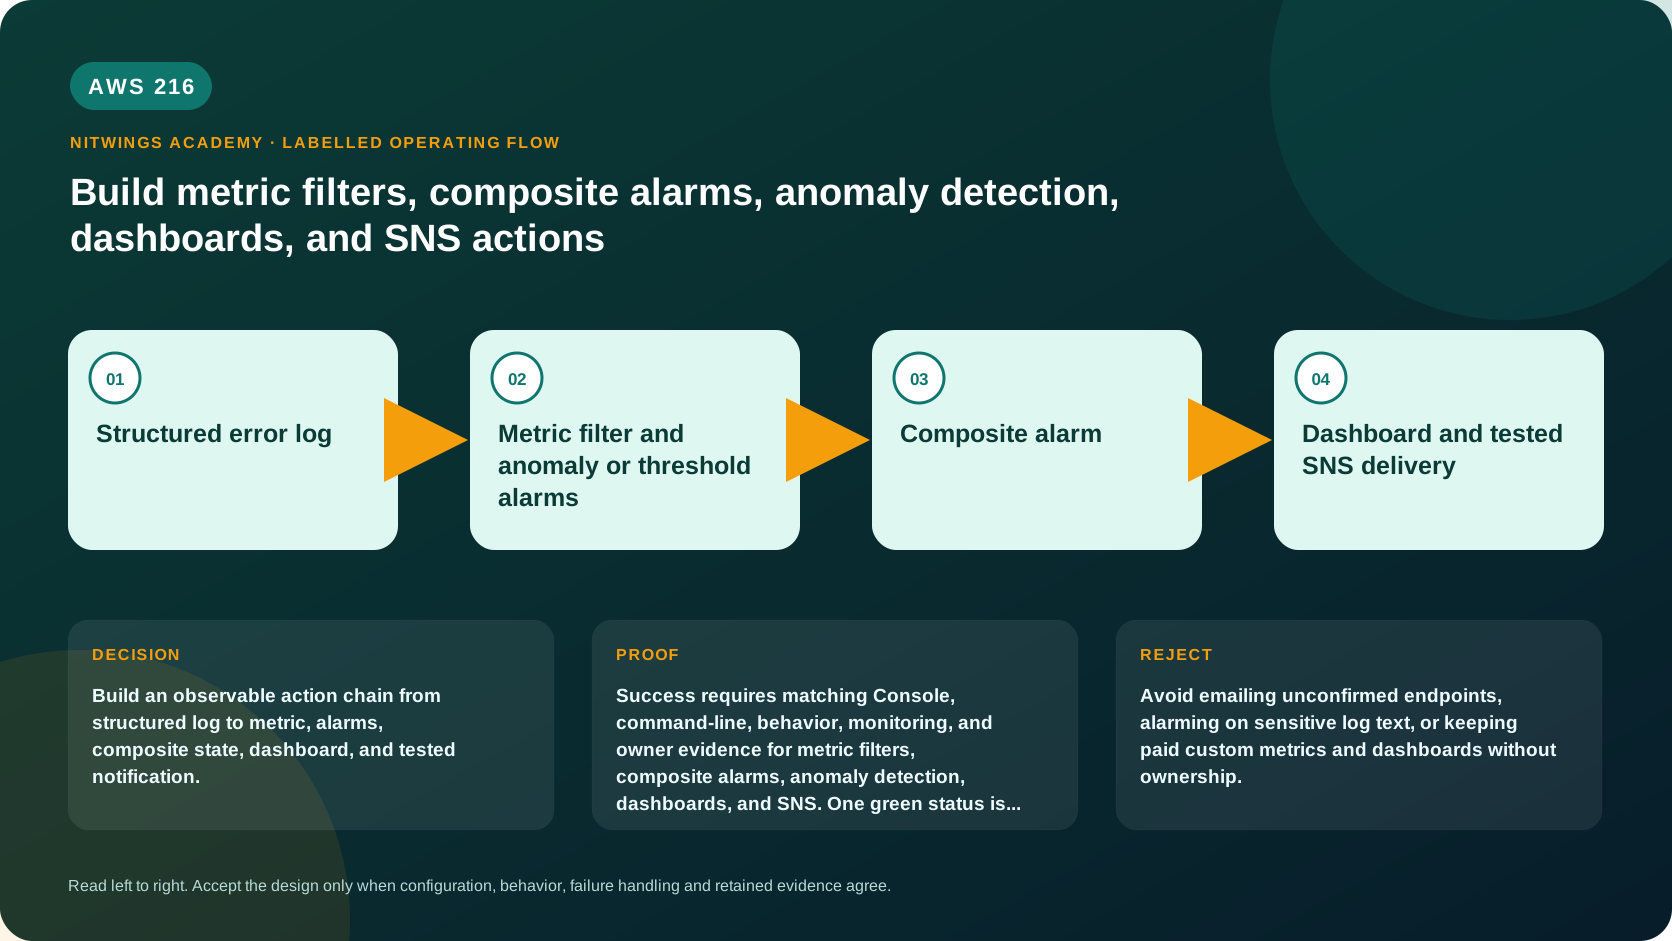
A log record is evidence, a metric filter turns matching records into a time series, an alarm evaluates that series, a composite alarm applies an operational rule, and an SNS topic routes the state change. A dashboard only visualizes this chain; it does not monitor or notify by itself. This lab builds each boundary and proves normal, alarm, suppression and recovery behavior.
What you will be able to do
By the end, you can:
- explain metric-filter matching, transformations, periods, evaluation periods and missing-data treatment;
- distinguish static threshold, anomaly-detection and composite alarms;
- create maintenance suppression without disabling the underlying detector;
- explain why a new anomaly model is not immediately trustworthy;
- create dashboard widgets with exact namespaces, dimensions, Regions and statistics;
- connect an alarm action to an owned SNS topic and distinguish publication from endpoint delivery;
- test ALARM, suppression and OK transitions, then delete only course-owned resources.
Before you start
- Use a personal AWS account only with owner approval. Do not use the root user for daily work.
- Continue with P10 from AWS214–215 or deploy it from the P10 runbook.
- Use
ap-south-1unless another Region is approved. Confirm account, Region, current prices and timer before creation. - Use only fake events. Never send customer data, credentials, secrets, account IDs or full ARNs to email or shared evidence.
- Email is optional and requires the endpoint owner's confirmation. A
PendingConfirmationsubscription receives nothing. - If creation is not approved, write the commands and predicted states without running them; that is the complete no-create track.
The complete signal path
/nw/p10/app JSON event
        |
        v
metric filter: level=WARN and event=order_validation
        |
        v
NitWings/P10 / ValidationWarnings (no dimensions)
        |
        +--> static child alarm -------------------+
        |                                          |
MaintenanceMode metric --> maintenance child ------+--> composite:
                                                       ALARM(error) AND NOT ALARM(maintenance)
                                                                  |
                                                                  v
                                                          SNS topic/action
Every component is Regional. A metric filter processes only new events ingested after the filter exists; it does not backfill old logs. This filter emits 1 for a match and default 0 for periods containing nonmatching events. A period with no ingested events can still have no datapoint, so alarm missing-data policy remains important.
Alarm concepts from first principles
| Control | Question answered | Important limitation |
|---|---|---|
| Metric filter | Did a new log event match this pattern? | No historical backfill; schema/case changes can stop matches. |
| Static alarm | Did a metric cross a known limit for enough periods? | Evaluation is period-based, not instantaneous. |
| Anomaly alarm | Is a value outside a learned expected band? | It needs representative history and can learn bad behavior as normal. |
| Composite alarm | Which Boolean combination of child states should page? | It watches alarm states, not raw metrics; avoid rule cycles. |
| Dashboard | What should an operator see together? | It has no notification behavior; a wrong dimension can look empty. |
| SNS | Where should an action publish? | Topic publication does not prove endpoint receipt. |
M-of-N means DatapointsToAlarm=M out of EvaluationPeriods=N. The missing-data choices - breaching, notBreaching, ignore, and missing - express different intent. This sparse fake event metric uses notBreaching; when silence itself is a fault, monitor a separate heartbeat.
Architecture decisions
| Requirement | Decision |
|---|---|
| One warning should trigger this short lab | Sum >= 1, 60-second period, 1 of 1. Production normally needs a less noisy M-of-N policy. |
| Planned maintenance should suppress notification | Keep detection active; composite is ALARM(error) AND NOT ALARM(maintenance). |
| Workload has stable history and seasonality | Consider anomaly detection after reviewing its learned model. |
| Brand-new or sparse metric | Do not make anomaly detection the only page. |
| Email owner has not confirmed | Record PendingConfirmation; do not claim delivery. |
| Sensitive text may match | Emit a count only; never copy log content into notification text. |
Build the chain with CloudShell
Set a known scope and discover the P10 node:
export AWS_DEFAULT_REGION="ap-south-1"
stack_name="nw-p10-observability"
aws sts get-caller-identity --query Arn --output text
instance_id="$(aws cloudformation describe-stacks --stack-name "$stack_name" --query 'Stacks[0].Outputs[?OutputKey==`ManagedNodeId`].OutputValue' --output text)"
test -n "$instance_id"
Create the log-derived metric and inspect the transformation:
aws logs put-metric-filter \
  --log-group-name /nw/p10/app \
  --filter-name nw-p10-validation-warnings \
  --filter-pattern '{ $.level = "WARN" && $.event = "order_validation" }' \
  --metric-transformations \
    metricName=ValidationWarnings,metricNamespace=NitWings/P10,metricValue=1,defaultValue=0,unit=Count

aws logs describe-metric-filters \
  --log-group-name /nw/p10/app \
  --filter-name-prefix nw-p10-validation-warnings --output json
Create two child alarms. Maintenance uses a deliberately published Boolean-like metric; no datapoint means maintenance is off:
aws cloudwatch put-metric-alarm \
  --alarm-name nw-p10-validation-warning \
  --alarm-description "P10 new WARN order-validation log event" \
  --namespace NitWings/P10 --metric-name ValidationWarnings \
  --statistic Sum --period 60 --evaluation-periods 1 --datapoints-to-alarm 1 \
  --threshold 1 --comparison-operator GreaterThanOrEqualToThreshold \
  --treat-missing-data notBreaching

aws cloudwatch put-metric-alarm \
  --alarm-name nw-p10-maintenance \
  --alarm-description "P10 operator-controlled maintenance suppression" \
  --namespace NitWings/P10 --metric-name MaintenanceMode \
  --statistic Maximum --period 60 --evaluation-periods 1 --datapoints-to-alarm 1 \
  --threshold 1 --comparison-operator GreaterThanOrEqualToThreshold \
  --treat-missing-data notBreaching
Create an owned topic. Add email only when its owner approves and then uses the received confirmation link:
topic_arn="$(aws sns create-topic --name nw-p10-operations \
  --tags Key=Project,Value=NitWings-P10 Key=Cleanup,Value=manual \
  --query TopicArn --output text)"
aws sns publish --topic-arn "$topic_arn" \
  --subject "P10 route test" --message "Fake P10 notification route test"

# Optional only after the address owner approves:
# aws sns subscribe --topic-arn "$topic_arn" --protocol email \
#   --notification-endpoint [email protected]
aws sns list-subscriptions-by-topic --topic-arn "$topic_arn" --output table
Direct publish proves caller-to-topic authorization. It proves endpoint delivery only when a confirmed subscriber supplies receipt evidence. Put the SNS action on the composite, not both child alarms:
aws cloudwatch put-composite-alarm \
  --alarm-name nw-p10-actionable-warning \
  --alarm-description "WARN alarm unless P10 maintenance is active" \
  --alarm-rule 'ALARM("nw-p10-validation-warning") AND NOT ALARM("nw-p10-maintenance")' \
  --actions-enabled --alarm-actions "$topic_arn"
Add anomaly detection as a learning control
AWS215 created OrdersValidated with Environment=lab. Create a detector and alarm referencing its band:
aws cloudwatch put-anomaly-detector \
  --namespace NitWings/P10 --metric-name OrdersValidated \
  --dimensions Name=Environment,Value=lab --stat Sum

aws cloudwatch put-metric-alarm \
  --alarm-name nw-p10-orders-anomaly \
  --evaluation-periods 2 --datapoints-to-alarm 2 \
  --comparison-operator LessThanLowerOrGreaterThanUpperThreshold \
  --threshold-metric-id ad1 --treat-missing-data notBreaching \
  --metrics '[{"Id":"m1","MetricStat":{"Metric":{"Namespace":"NitWings/P10","MetricName":"OrdersValidated","Dimensions":[{"Name":"Environment","Value":"lab"}]},"Period":60,"Stat":"Sum"},"ReturnData":true},{"Id":"ad1","Expression":"ANOMALY_DETECTION_BAND(m1,2)","Label":"expected band","ReturnData":true}]'

aws cloudwatch describe-anomaly-detectors \
  --namespace NitWings/P10 --metric-name OrdersValidated --output json
The detector can exist before its model is useful. Record state and band visibility; do not force or claim an anomaly from five points. Production evidence must include representative weekdays, weekends, deployments and seasonal peaks.
Create the dashboard in the Console
Open CloudWatch > Dashboards > Create dashboard, name it nw-p10-operations, and add:
OrdersValidated, exactEnvironment=lab, Sum, 1 minute;ValidationWarnings, Sum, 1 minute;- an alarm-status widget with both children, the anomaly alarm and composite;
- a Logs Insights widget for
/nw/p10/app:
fields @timestamp, level, event, outcome, request_id
| filter event = "order_validation"
| sort @timestamp desc
| limit 20
Save and reopen it. Verify Region, metric dimensions, period and absolute UTC range. Do not interpret an empty widget as zero until scope and missing-data behavior are proved.
Test four states
- Normal: both child alarms and composite are
OK. - Suppressed: publish
MaintenanceMode=1, wait for maintenanceALARM, then generate WARN events. Warning becomesALARM; composite remainsOK. - Actionable: publish
MaintenanceMode=0, wait for maintenanceOK, then generate a changed WARN event. Composite becomesALARMand invokes SNS. - Recovery: append a nonmatching INFO event and let the metric filter's default zero evaluate. Warning and composite return to
OK.
aws cloudwatch put-metric-data --namespace NitWings/P10 \
  --metric-data MetricName=MaintenanceMode,Value=1,Unit=Count

command_id="$(aws ssm send-command --instance-ids "$instance_id" \
  --document-name AWS-RunShellScript \
  --parameters 'commands=["sudo /usr/local/bin/nw-p10-publish-order-events"]' \
  --query Command.CommandId --output text)"
aws ssm wait command-executed --command-id "$command_id" --instance-id "$instance_id"

aws cloudwatch put-metric-data --namespace NitWings/P10 \
  --metric-data MetricName=MaintenanceMode,Value=0,Unit=Count
Running the helper again repeats fake IDs; identify each test by new event/ingestion time. Wait at least one full period after ingestion. Capture history instead of causing a publication storm:
aws cloudwatch describe-alarms --alarm-name-prefix nw-p10- --output table
aws cloudwatch describe-alarm-history \
  --alarm-name nw-p10-actionable-warning --max-records 20 --output json
Diagnose this topic from its evidence
| Symptom | Prove first | Correction |
|---|---|---|
| Filter exists but metric is absent | new matching event after filter creation; JSON field names/case | publish one changed fake event; fix the tested pattern |
Child remains INSUFFICIENT_DATA | first datapoint, period, evaluation count, missing-data policy | wait a period or correct metric identity |
| Child ALARM but composite OK | full rule and all child states | maintenance suppression may be correct |
| Composite ALARM but no email | alarm history action, topic ARN, subscription state | confirm approved endpoint; do not recreate blindly |
| Dashboard empty | Region, range, namespace, dimensions, statistic | select the exact series |
| No anomaly band | detector state and historical shape | collect representative history; retain static safety alarm |
Cost and cleanup
Price custom metrics, standard/composite alarms, anomaly detection, dashboard, SNS delivery, log ingestion/storage/query scans and P10 EC2 runtime using current Regional pages.
Delete manually created resources before the stack:
aws cloudwatch delete-alarms --alarm-names \
  nw-p10-actionable-warning nw-p10-orders-anomaly \
  nw-p10-validation-warning nw-p10-maintenance
aws cloudwatch delete-anomaly-detector \
  --namespace NitWings/P10 --metric-name OrdersValidated \
  --dimensions Name=Environment,Value=lab --stat Sum
aws cloudwatch delete-dashboards --dashboard-names nw-p10-operations
aws logs delete-metric-filter --log-group-name /nw/p10/app \
  --filter-name nw-p10-validation-warnings
aws sns delete-topic --topic-arn "$topic_arn"
Custom metric history cannot be manually deleted; stop publishing and let retention expire. Keep P10 only if AWS217 begins immediately under the same approval/timer; otherwise use the P10 runbook to delete the stack and prove final inventory.
Knowledge check
- Why can old matching logs produce no filter metric?
Filters process newly ingested events and do not backfill.
- Why keep the error child active during maintenance?
It preserves detection evidence while only the composite action is suppressed.
- What does an SNS action prove?
Alarm history proves action invocation; endpoint receipt needs confirmed delivery evidence.
- Why is anomaly detection weak in this lab?
Five points do not represent seasonality or workload variance.
- Why omit request ID as a metric dimension?
It limits time-series cardinality, cost and privacy exposure.
Lesson acceptance
- Exact group, filter pattern, transformation, namespace, unit and missing-data behavior are recorded.
- Child alarms and composite reach predicted normal, suppressed, actionable and recovery states.
- SNS topic publication is proved; endpoint delivery is claimed only with confirmed evidence.
- Dashboard widgets use the correct Region, dimension, statistic, period and UTC range.
- The anomaly detector is honestly classified as trained or not yet trained and is not the sole safety signal.
- Manual resources are deleted in dependency order; retained metric history and P10 disposition are documented.