
AWS 217: Troubleshoot missing metrics, delayed logs, alarm state, and notification delivery
Why this lesson matters
A missing graph can mean no publisher, wrong account or Region, a different dimension set, an old time window, delayed ingestion, or genuinely no data. An incorrect alarm can instead be evaluating exactly the configuration it was given. This lab teaches you to find the first broken boundary and change one variable at a time.
What you will be able to do
By the end, you can:
- classify a symptom as publication, identity/permission, scope, ingestion, evaluation or delivery failure;
- prove exact metric identity: account, Region, namespace, name, complete dimensions, unit, statistic and time range;
- compare log event time, ingestion time and query time without mistaking delay for loss;
- explain alarm state reason, M-of-N evaluation and missing-data policy from alarm history;
- separate CloudWatch-to-SNS action invocation, SNS subscription confirmation and endpoint receipt;
- perform reversible agent and alarm faults, one at a time, with a changed retest;
- restore P10 and prove cleanup from an inventory rather than memory.
Before you start
- Use a personal AWS account only when its owner has approved the lesson. Do not use the root user for daily work.
- CloudShell is the default command environment. AWS028 explains CloudShell; AWS029 and AWS030 explain local AWS CLI installation and profiles.
- The course example Region is
ap-south-1. Global services and services with a required control Region are called out in their commands. - Run
aws sts get-caller-identityprivately. Redact the account number before sharing evidence. - Never paste access keys, passwords, secret values, private object data, presigned URLs, or full account-specific ARNs into a submission.
- This lesson has an optional live path. Check current prices, obtain the account owner's approval, set a hard timer, use course tags, and complete the stated cleanup. The evidence path is a complete alternative.
- Console wording can change. Use the Console service search if a menu label has moved, then confirm the current field in the official documentation.
The core model
| Question | What it means in this lesson |
|---|---|
| Purpose | Diagnose missing metrics, late logs, incorrect alarm state, and failed notification by following publisher, permission, scope, timestamp, dimensions, evaluation, and endpoint delivery. |
| Scope and boundary | For CloudWatch telemetry troubleshooting, separate account and Region scope, identity, configuration, data or network behavior, failure ownership, evidence retention, and cleanup. |
| Evidence of success | Success requires matching Console, command-line, behavior, monitoring, and owner evidence for CloudWatch telemetry troubleshooting. One green status is not enough. |
| Cost model | Requests, running capacity, stored telemetry, retained history, data transfer, and connected resources must be priced for the exact design. |
| Safe rejection rule | Avoid changing four settings at once, publishing storms, weakening permissions broadly, or calling delayed delivery data loss without timestamps. |
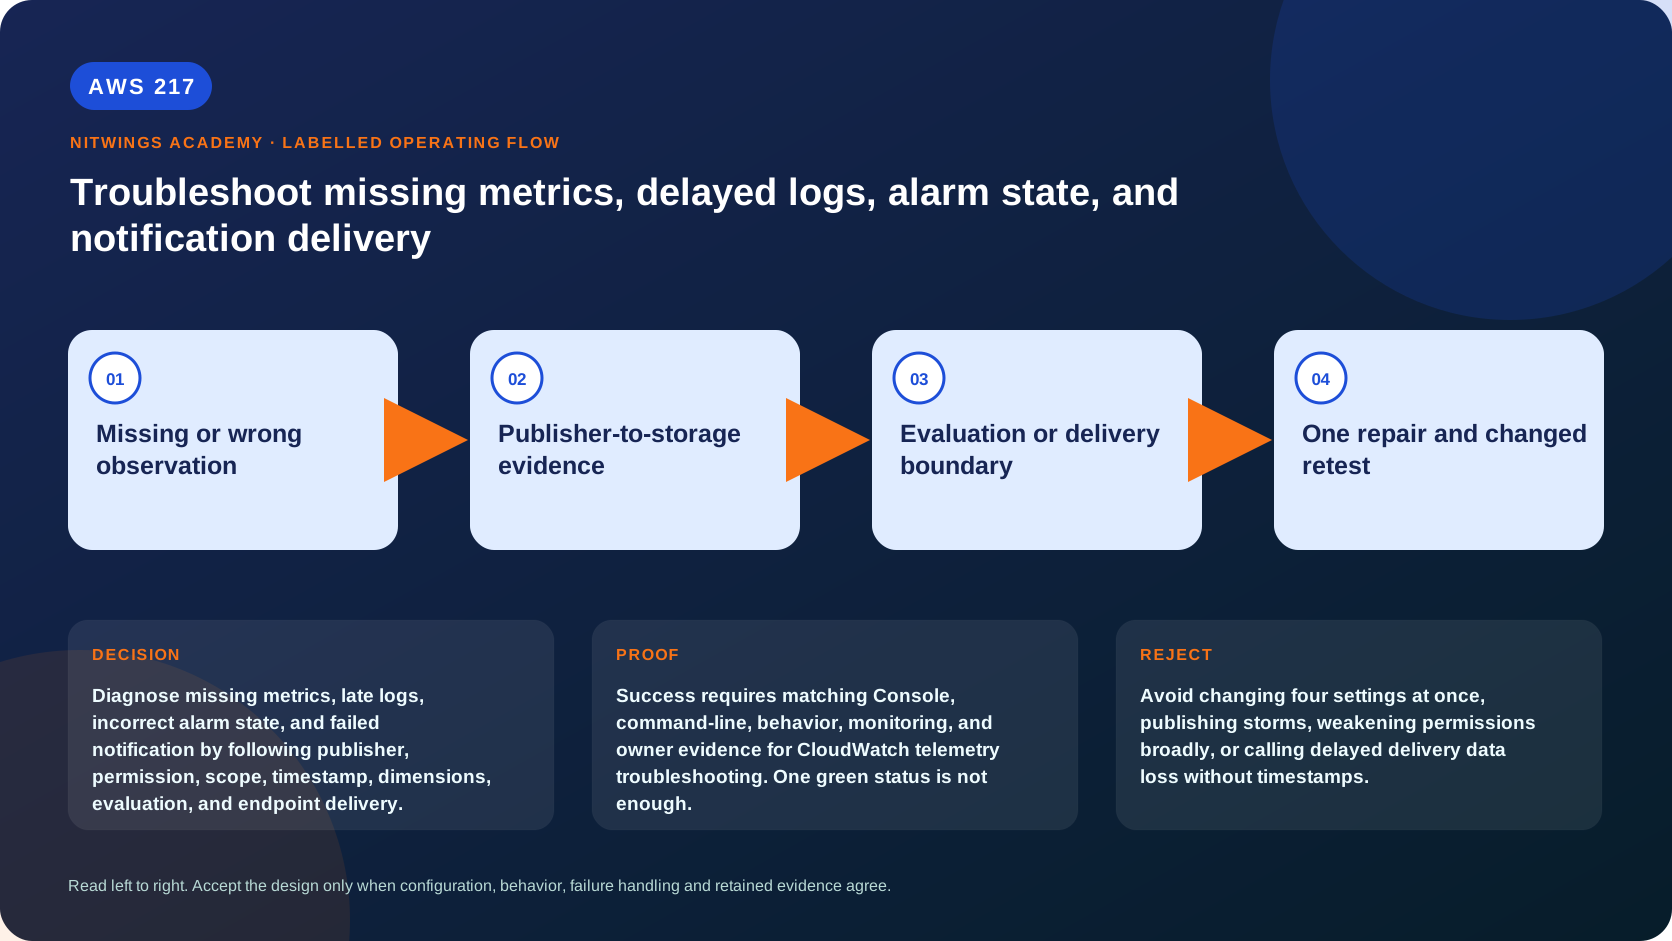
How the request flows
+--------------------------------+
|  Missing or wrong observation  |
+--------------------------------+
                |
                v
+---------------------------------+
|  Publisher-to-storage evidence  |
+---------------------------------+
                |
                v
+-----------------------------------+
|  Evaluation or delivery boundary  |
+-----------------------------------+
                 |
                 v
+---------------------------------+
|  One repair and changed retest  |
+---------------------------------+
Troubleshoot left to right: producer process and local file, credentials and API result, account/Region/resource identity, CloudWatch ingestion, alarm evaluation, action invocation, SNS topic/subscription, then receiving endpoint. A downstream symptom does not prove its downstream component is at fault.
Evidence map
| Boundary | Strong evidence | Common false conclusion |
|---|---|---|
| Metric publisher | successful API response or running agent plus recent datapoint | list-metrics entry means data is current |
| Metric selection | exact namespace/name/all dimensions/unit/statistic/UTC window | same metric name means same series |
| Log producer | local one-line JSON and file offset/time | no query result means event was never written |
| Log ingestion | log stream's last ingestion time and matching event | event timestamp equals arrival timestamp |
| Alarm evaluator | StateReasonData, history, threshold, M/N and missing policy | ALARM means the application is definitely broken |
| Alarm action | alarm history reports SNS action attempt | endpoint received the message |
| SNS delivery | confirmed subscription and endpoint-side receipt evidence | topic exists, therefore email works |
Architecture decision table
| Situation | Direction | Reason |
|---|---|---|
| Requirement matches | Use the sequence to find the first broken boundary instead of recreating telemetry blindly. | Select only after scope, behavior, security, recovery, operations, and price evidence agree. |
| Requirement does not match | Avoid changing four settings at once, publishing storms, weakening permissions broadly, or calling delayed delivery data loss without timestamps. | Rejecting an attractive service is a valid architecture result. |
| No create permission or cost approval | Use supplied evidence and local design work | Learning does not depend on creating an hourly resource. |
| Existing resource is unknown or unowned | Inspect only, then stop | Never change or delete a resource merely because it resembles a course example. |
AWS Management Console, step by step
Sign in with the normal non-root learning identity. Write the expected starting state before opening the service.
- Confirm account and Region, then open CloudWatch > Metrics > All metrics. Select
NitWings/P10and compare the correctOrdersValidated / Environment=labseries with a deliberately wrong dimension. - Open Logs > Log groups > /nw/p10/app. Use an absolute UTC range and compare
@timestampwith@ingestionTime. - Open Alarms, select each
nw-p10-alarm, and read History plus the current state reason. Record threshold, statistic, period, evaluation periods, datapoints to alarm and missing-data policy. - Open SNS > Topics > nw-p10-operations > Subscriptions. Record protocol and
Confirmedstatus. Check the receiving system separately; the SNS page is not endpoint receipt evidence. - Open CloudTrail > Event history for configuration calls such as
PutMetricAlarmorSubscribe. CloudTrail management events prove control changes, not telemetry delivery.
CloudShell and AWS CLI, step by step
Start with a known caller and Region:
export AWS_DEFAULT_REGION="ap-south-1"
aws sts get-caller-identity --query Arn --output text
aws configure list
Redact the account part of the ARN in shared evidence. Resolve exact P10 identities and capture the baseline before changing anything:
stack_name="nw-p10-observability"
instance_id="$(aws cloudformation describe-stacks --stack-name "$stack_name" --query 'Stacks[0].Outputs[?OutputKey==`ManagedNodeId`].OutputValue' --output text)"
topic_arn="$(aws sns list-topics --query 'Topics[?ends_with(TopicArn, `:nw-p10-operations`)].TopicArn | [0]' --output text)"

aws cloudwatch list-metrics --namespace NitWings/P10 --output json
aws logs describe-log-streams --log-group-name /nw/p10/app \
  --order-by LastEventTime --descending --limit 10 --output json
aws cloudwatch describe-alarms --alarm-name-prefix nw-p10- --output json
aws cloudwatch describe-alarm-history \
  --alarm-name nw-p10-actionable-warning --max-records 50 --output json
test "$topic_arn" = "None" || \
  aws sns list-subscriptions-by-topic --topic-arn "$topic_arn" --output json
Expected interpretation
Save timestamps and StateReasonData, not just screenshots. describe-log-streams --order-by LastEventTime cannot also use a log-stream-name prefix, and its last-event field is eventually consistent; confirm important events with an actual filtered query.
Practical work
Resolve the following four faults in order. Restore each before starting the next.
Fault 1: the metric is present but the graph is empty
Query the same metric twice over the last 30 minutes - first with the correct dimension and then with Environment=wrong. No data for the wrong series is the expected negative result, not a publication failure.
start="$(date -u -d '30 minutes ago' +%Y-%m-%dT%H:%M:%SZ)"
end="$(date -u +%Y-%m-%dT%H:%M:%SZ)"
for environment in lab wrong; do
  aws cloudwatch get-metric-statistics \
    --namespace NitWings/P10 --metric-name OrdersValidated \
    --dimensions Name=Environment,Value="$environment" \
    --start-time "$start" --end-time "$end" --period 60 \
    --statistics Sum SampleCount --output json
done
If both are empty, inspect publication time and widen only the UTC window. Do not republish until account, Region and complete dimension set agree.
Fault 2: local logs exist but CloudWatch is delayed
Stop only the CloudWatch Agent, append a unique fake marker while stopped, prove it exists locally, then restart with the reviewed SSM configuration:
stop_id="$(aws ssm send-command --instance-ids "$instance_id" \
  --document-name AWS-RunShellScript \
  --parameters 'commands=["sudo /opt/aws/amazon-cloudwatch-agent/bin/amazon-cloudwatch-agent-ctl -m ec2 -a stop","printf '\''{\"timestamp\":\"%s\",\"level\":\"WARN\",\"service\":\"p10-demo\",\"event\":\"agent_gap_test\",\"request_id\":\"p10-gap-001\"}\\n'\'' "$(date -u +%Y-%m-%dT%H:%M:%SZ)" | sudo tee -a /var/log/nw-p10-app.log >/dev/null","sudo tail -n 1 /var/log/nw-p10-app.log"]' \
  --query Command.CommandId --output text)"
aws ssm wait command-executed --command-id "$stop_id" --instance-id "$instance_id"

restart_id="$(aws ssm send-command --instance-ids "$instance_id" \
  --document-name AmazonCloudWatch-ManageAgent \
  --parameters 'action=configure,mode=ec2,optionalConfigurationSource=ssm,optionalConfigurationLocation=/nw/p10/agent-config,optionalRestart=yes' \
  --query Command.CommandId --output text)"
aws ssm wait command-executed --command-id "$restart_id" --instance-id "$instance_id"
aws logs filter-log-events --log-group-name /nw/p10/app \
  --filter-pattern '"p10-gap-001"' --output json
Record event time, restart time and ingestion time. A later ingestion time with the original event time proves buffering/delay. If absent, inspect command output, agent status/configuration log, file permissions and outbound HTTPS before changing IAM.
Fault 3: silence produces the wrong alarm state
Capture the full warning alarm first. Change only missing-data treatment to breaching by repeating every required alarm property, observe after a full period, then restore notBreaching. put-metric-alarm replaces the configuration; omitting properties can unintentionally remove them.
aws cloudwatch describe-alarms --alarm-names nw-p10-validation-warning --output json

aws cloudwatch put-metric-alarm --alarm-name nw-p10-validation-warning \
  --alarm-description "P10 new WARN order-validation log event" \
  --namespace NitWings/P10 --metric-name ValidationWarnings --statistic Sum \
  --period 60 --evaluation-periods 1 --datapoints-to-alarm 1 --threshold 1 \
  --comparison-operator GreaterThanOrEqualToThreshold --treat-missing-data breaching

# After recording the incorrect silence=ALARM behavior, restore:
aws cloudwatch put-metric-alarm --alarm-name nw-p10-validation-warning \
  --alarm-description "P10 new WARN order-validation log event" \
  --namespace NitWings/P10 --metric-name ValidationWarnings --statistic Sum \
  --period 60 --evaluation-periods 1 --datapoints-to-alarm 1 --threshold 1 \
  --comparison-operator GreaterThanOrEqualToThreshold --treat-missing-data notBreaching
Fault 4: alarm action ran but notification was not received
Read composite alarm history, confirm the configured topic ARN, list subscriptions, and inspect the endpoint's own evidence. PendingConfirmation is not fixed by repeatedly subscribing. The address owner must use the confirmation link. If alarm history reports authorization failure, inspect the topic policy/KMS key policy and caller context; do not grant sns:*.
aws cloudwatch describe-alarm-history \
  --alarm-name nw-p10-actionable-warning --history-item-type Action \
  --max-records 20 --output json
aws sns get-topic-attributes --topic-arn "$topic_arn" --output json
aws sns list-subscriptions-by-topic --topic-arn "$topic_arn" --output json
aws cloudtrail lookup-events \
  --lookup-attributes AttributeKey=EventName,AttributeValue=PutCompositeAlarm \
  --max-results 20 --output json
Break-fix record
For every fault capture: expected/actual UTC time, producer, caller/role, Region, namespace or group, dimensions, unit, hypothesis, one change, changed test, result and restoration. Never change multiple settings to make a red dashboard green.
Diagnose this topic from its own evidence
| Symptom | First decisive check | Do not do |
|---|---|---|
| Metric name listed, no points | get-metric-statistics on exact full identity/window | assume discovery means current data |
| Event local, absent remotely | agent state/config/log, offset and outbound 443 | broaden IAM before proving denial |
| Remote event appears late | event versus ingestion timestamp | rewrite producer timestamp |
| Alarm disagrees with graph | alarm statistic/period/dimensions/M-of-N/missing policy | use dashboard defaults as alarm truth |
| Composite seems inverted | every child state and full Boolean rule | disable all alarm actions |
| SNS action succeeded, no receipt | subscription confirmation and endpoint evidence | claim delivery from topic existence |
Cost and cleanup
Troubleshooting can increase cost through repeated custom metric points, Logs Insights scanned bytes, retained logs, alarms/SNS and longer EC2 runtime. Query a narrow absolute window and inject one changed event per hypothesis.
Restore the warning alarm to notBreaching, confirm the agent is running, and repeat AWS216 cleanup for dashboard, composite/child alarms, detector, metric filter and topic. Then delete P10 with its runbook. Custom metric history remains until CloudWatch retention expires and cannot be manually deleted.
Knowledge check
- What operational purpose is this lesson solving?
Expected direction: Diagnose missing metrics, late logs, incorrect alarm state, and failed notification by following publisher, permission, scope, timestamp, dimensions, evaluation, and endpoint delivery.
- Which scope or ownership boundary must be proved first?
Expected direction: For CloudWatch telemetry troubleshooting, separate account and Region scope, identity, configuration, data or network behavior, failure ownership, evidence retention, and cleanup.
- What evidence is strong enough to accept the result?
Expected direction: Success requires matching Console, command-line, behavior, monitoring, and owner evidence for CloudWatch telemetry troubleshooting. One green status is not enough.
- Which tempting design or shortcut must be rejected?
Expected direction: Avoid changing four settings at once, publishing storms, weakening permissions broadly, or calling delayed delivery data loss without timestamps.
- Which cost dimensions and retained resources need an owner?
Expected direction: Requests, running capacity, stored telemetry, retained history, data transfer, and connected resources must be priced for the exact design.
Lesson acceptance
- Each fault has a baseline, one hypothesis, one controlled change, changed retest and explicit restoration.
- Correct and wrong metric dimensions produce explainable positive/negative results.
- Agent-stop evidence proves local write, delayed ingestion and successful restart without opening inbound access.
- Alarm history proves how missing-data policy changed state and that the original policy was restored.
- Alarm action, SNS topic publication, subscription confirmation and endpoint receipt are reported as separate facts.
- Manual alarm-chain resources and the P10 stack are deleted, or an approved owner/timer for immediate continuation is recorded.