
AWS 218: Analyze compute, storage, database, container, and serverless performance
Why this lesson matters
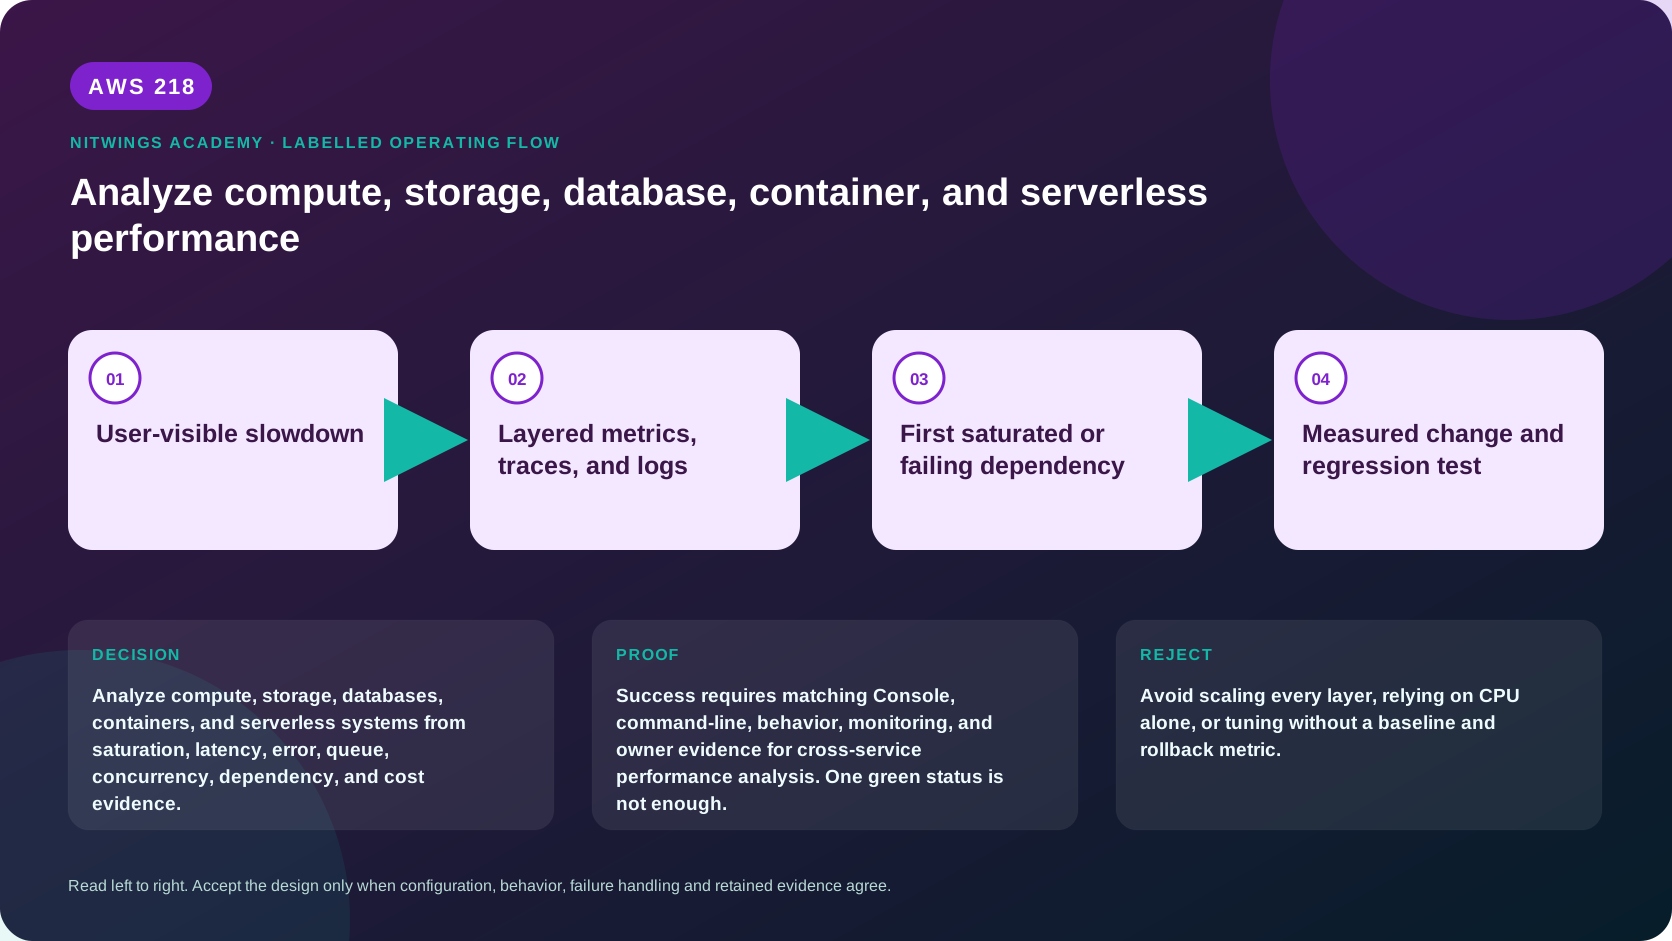
High CPU is not automatically a CPU problem, low CPU is not proof of spare capacity, and adding capacity does not repair locks, retries or a slow dependency. An architect starts with a user-visible objective, aligns evidence to one UTC interval, finds the first constrained boundary, changes one thing, and compares the same workload before and after.
This lesson uses the small P10 EC2/EBS stack for live read-only evidence. RDS/Aurora, ECS and Lambda are analyzed from an approved existing environment or the supplied scenarios; the lesson does not create four unrelated paid platforms merely to draw graphs.
What you will be able to do
By the end, you can:
- use request-rate/error/duration (RED) and utilization/saturation/error (USE) models;
- separate workload demand from resource utilization, saturation, service limits and dependency delay;
- select meaningful EC2, EBS, RDS/Aurora, ECS and Lambda metrics with correct statistics;
- distinguish host, guest, service, application and downstream evidence;
- identify CPU-credit, IOPS, throughput, queue, database-wait, task-capacity and concurrency constraints;
- propose one measurable correction with risk, rollback and acceptance thresholds;
- reject blind scaling when evidence points to code, configuration, locking or dependencies.
Before you start
- Use only course-owned P10 or an environment whose owner approved read-only inspection. Do not modify production.
- Confirm account, Region, resource owner and one absolute UTC analysis window.
- Record the workload shape: requests, operation mix, payload size, concurrency and deployment/configuration version.
- Do not compare different periods, workloads or percentiles and call the difference an improvement.
- Advanced monitoring features such as detailed EC2 monitoring, Container Insights, RDS Enhanced Monitoring and Database Insights can add cost.
- Since July 31, 2026, use the current CloudWatch Database Insights experience for RDS database-load analysis; do not teach the retired standalone Performance Insights console as the destination.
The performance method
user symptom/SLO
      |
      v
same UTC window + same workload + recent changes
      |
      v
RED at request boundary: rate, errors, duration percentiles
      |
      v
USE at each resource: utilization, saturation, errors
      |
      v
first constrained dependency
      |
      v
one change -> same test -> acceptance or rollback
Average hides tails. Prefer p95/p99 latency where the metric supports percentiles, Sum for counts, Maximum for concurrency or binary failure, and rates calculated over the exact period. Never average an average across differently weighted series unless that aggregation is intentional.
Cross-service evidence map
| Layer | Demand | Utilization/capacity | Saturation/failure | Interpretation traps |
|---|---|---|---|---|
| EC2 | request/network rate, processes | CPUUtilization; agent memory/disk; CPU credits for burstable types | status checks, run queue, swap, packet errors, EBS/NIC allowances | basic monitoring is normally 5-minute; memory/filesystem need an agent; low CPU can hide one saturated thread |
| EBS | read/write ops and bytes | provisioned IOPS/throughput, BurstBalance where applicable | VolumeQueueLength, read/write latency, VolumeIOPSExceededCheck, VolumeThroughputExceededCheck, VolumeStalledIOCheck where supported | gp3 has independent IOPS/throughput settings; queue meaning and statistics differ on Nitro |
| RDS/Aurora | transactions/queries/connections | CPU, FreeableMemory, IOPS/throughput, connection limits | read/write latency, DiskQueueDepth, locks/wait events, replica lag | high connections are not the same as active DB load; cache use can make low free memory normal |
| ECS | desired/running/pending tasks, request rate | service CPU/memory; capacity-provider resources | pending tasks, restarts, deployment failures, target errors/latency | service averages hide one hot task; EC2 launch type also requires host analysis |
| Lambda | Invocations and event-source backlog | ConcurrentExecutions Maximum, memory used from logs/Insights | Errors, Throttles, Duration p95/p99, iterator age/offset lag, async drops | throttled requests are not counted as Invocations; Duration alone does not identify downstream time |
Metric availability depends on instance family, volume type, launch type, engine and enabled monitoring. List the metric with its exact dimension set before building a conclusion.
EC2 and EBS: live P10 analysis
Discover the course-owned node and root volume:
export AWS_DEFAULT_REGION="ap-south-1"
stack_name="nw-p10-observability"
aws sts get-caller-identity --query Arn --output text
instance_id="$(aws cloudformation describe-stacks --stack-name "$stack_name" --query 'Stacks[0].Outputs[?OutputKey==`ManagedNodeId`].OutputValue' --output text)"
volume_id="$(aws ec2 describe-instances --instance-ids "$instance_id" --query 'Reservations[0].Instances[0].BlockDeviceMappings[0].Ebs.VolumeId' --output text)"
aws ec2 describe-instance-status --instance-ids "$instance_id" --include-all-instances --output json
aws ec2 describe-volumes --volume-ids "$volume_id" \
  --query 'Volumes[0].{Type:VolumeType,Size:Size,Iops:Iops,Throughput:Throughput,Encrypted:Encrypted,State:State}' --output table
Use one absolute 30-minute window. P10's agent metric has both InstanceId and InstanceType dimensions, so discover the exact series first instead of guessing:
start="$(date -u -d '30 minutes ago' +%Y-%m-%dT%H:%M:%SZ)"
end="$(date -u +%Y-%m-%dT%H:%M:%SZ)"
instance_type="$(aws ec2 describe-instances --instance-ids "$instance_id" --query 'Reservations[0].Instances[0].InstanceType' --output text)"

aws cloudwatch get-metric-statistics --namespace AWS/EC2 \
  --metric-name CPUUtilization --dimensions Name=InstanceId,Value="$instance_id" \
  --start-time "$start" --end-time "$end" --period 300 \
  --statistics Average Maximum --output json

aws cloudwatch get-metric-statistics --namespace NitWings/P10 \
  --metric-name mem_used_percent \
  --dimensions Name=InstanceId,Value="$instance_id" Name=InstanceType,Value="$instance_type" \
  --start-time "$start" --end-time "$end" --period 60 \
  --statistics Average Maximum --output json

for metric in VolumeReadOps VolumeWriteOps VolumeReadBytes VolumeWriteBytes VolumeQueueLength; do
  aws cloudwatch get-metric-statistics --namespace AWS/EBS \
    --metric-name "$metric" --dimensions Name=VolumeId,Value="$volume_id" \
    --start-time "$start" --end-time "$end" --period 300 \
    --statistics Sum Average Maximum --output json
done
The broad statistic request is for comparison; interpret only statistics AWS documents as meaningful for that metric and attachment platform. For latency, use metric math or calculate over the same period:
- average read latency =
VolumeTotalReadTime / VolumeReadOps; - average write latency =
VolumeTotalWriteTime / VolumeWriteOps; - average IOPS =
(VolumeReadOps + VolumeWriteOps) / period_seconds; - average throughput =
(VolumeReadBytes + VolumeWriteBytes) / period_seconds.
Do not divide when operation count is zero. Compare observed demand with the volume's configured IOPS/throughput and the instance's EBS limits. A growing queue plus latency and exceeded-check evidence is stronger than queue length alone.
RDS and Aurora analysis
For an approved database, correlate:
- client latency/error/request rate;
CPUUtilization,FreeableMemory,SwapUsage,DatabaseConnections, IOPS, throughput, read/write latency andDiskQueueDepth;- Database Insights DB load, top wait events, SQL and hosts;
- engine logs, locks, slow queries, cache behavior and replica lag;
- deployment, parameter-group, schema/index and workload changes.
DB load expressed as average active sessions can be compared with vCPU as a clue, not a verdict: CPU waits suggest compute pressure; I/O waits suggest storage or cache behavior; lock waits point to transaction design. Scaling CPU does not remove a blocking transaction or missing index. Enhanced Monitoring provides operating-system process/CPU/memory/I/O evidence; Database Insights provides database-load and wait evidence. Advanced mode has its own retention and cost requirements.
Read-only inventory:
aws rds describe-db-instances \
  --query 'DBInstances[].{Id:DBInstanceIdentifier,Class:DBInstanceClass,Engine:Engine,Storage:StorageType,Insights:DatabaseInsightsMode,PI:PerformanceInsightsEnabled,Enhanced:MonitoringInterval}' \
  --output table
aws rds describe-events --duration 1440 --output table
ECS performance analysis
Start with service desired/running/pending counts, deployment events and target health. Then correlate service CPUUtilization and MemoryUtilization with request rate, ALB target response time, HTTP 5xx and task restarts. Container Insights adds per-task and storage/network detail at additional cost.
For Fargate, inspect task sizing, ephemeral storage and platform quotas. For EC2 launch type, continue into capacity-provider/Auto Scaling and host CPU, memory, disk and agent health. A service average of 50% can hide one task at 100%; inspect task distribution before scaling the whole service.
aws ecs list-clusters --output table
# For an approved cluster:
# aws ecs list-services --cluster approved-cluster --output table
# aws ecs describe-services --cluster approved-cluster --services approved-service --output json
aws cloudwatch list-metrics --namespace AWS/ECS --metric-name CPUUtilization --output json
Lambda and event-driven performance analysis
Correlate Invocations Sum, Errors Sum/rate, Throttles Sum, Duration p95/p99 and ConcurrentExecutions Maximum. Compare claimed/account concurrency, function reserved concurrency and provisioned concurrency where configured. For streams, watch IteratorAge; for Kafka, offset lag; for SQS, age and visible-message backlog; for asynchronous invocation, retries/dropped events and destinations.
Throttled requests are not counted as Lambda Invocations, so an invocation graph alone understates attempted demand. More memory also allocates more CPU for standard Lambda functions and may reduce duration/cost, but must be benchmarked. A duration spike with flat concurrency can be downstream latency, DNS/network connection setup, lock contention or code - not a concurrency shortage.
aws lambda get-account-settings --output json
aws lambda list-functions \
  --query 'Functions[].{Name:FunctionName,Memory:MemorySize,Timeout:Timeout,Runtime:Runtime}' \
  --output table
aws cloudwatch list-metrics --namespace AWS/Lambda --metric-name Throttles --output json
Five analysis scenarios
| Scenario | Evidence | Most defensible first conclusion | Measured next step |
|---|---|---|---|
| EC2 latency rises; total CPU 30%; one process thread at 100% | request p99 and guest per-core/process evidence align | single-thread/code constraint, not unused fleet CPU proof | profile or parallelize; compare same request mix |
| EBS latency/queue and exceeded checks rise; CPU is stable | ops/bytes approach provisioned performance | volume/instance storage path is saturated | benchmark one gp3 IOPS/throughput change; rollback settings if no p95 gain |
| RDS DB load dominated by lock wait; CPU 25% | blocking session and SQL timeline align | transaction contention | end/repair blocker and shorten transaction; do not resize first |
| ECS service average CPU 55%; one task hot; ALB p99 rises | task-level distribution and target evidence align | uneven traffic/work partition | repair balancing/partitioning, then retest before scaling |
| Lambda throttles and queue age rise at concurrency limit | Throttles, Maximum concurrency and backlog align | concurrency is constrained | remove accidental reservation or request/allocate capacity; verify downstream can absorb it |
For every case record: symptom/SLO, exact UTC window, workload shape, recent change, metric identity/statistic, first constrained boundary, alternative hypothesis, one change, risk, rollback trigger and before/after result.
Diagnose misleading evidence
| Symptom | Check before scaling |
|---|---|
| High average CPU | request throughput, useful work, steal/credits, per-core/thread, error and latency |
| Low free memory | cache behavior, swap/page faults and application pressure |
| High EBS queue | Nitro semantics, I/O size, IOPS/throughput, latency and instance EBS limit |
| Many DB connections | active versus idle sessions, DB load/waits and pool configuration |
| ECS tasks pending | events, capacity provider, subnet IPs, image pull, IAM and quotas |
| Lambda errors | function logs, timeout, dependency status, retries and payload/permission failures |
| Empty graph | account, Region, time, namespace, full dimensions, statistic and publication cadence |
Change safety, cost and cleanup
A performance change can move the bottleneck and increase cost. Define success and rollback before changing instance class, EBS settings, DB capacity, task count, Lambda memory/concurrency or monitoring level. Include compute runtime, provisioned IOPS/throughput, database instance/storage/I/O, Container Insights ingestion, Lambda duration/concurrency, log scans and data transfer.
This lesson creates no new RDS, ECS or Lambda resources. Restore any approved temporary monitoring change. Complete AWS216–217 manual alarm-chain cleanup, then delete P10 through its runbook unless the next lesson explicitly reuses it under a new owner/timer. Prove the final tagged inventory.
Knowledge check
- Why can low EC2 CPU coexist with high latency?
A single thread, memory/storage/network wait or downstream dependency can constrain the request.
- Why is EBS queue length alone insufficient?
Platform semantics, I/O size, latency, configured limits and exceeded checks provide necessary context.
- Why might resizing RDS not fix high DB load?
Locks, inefficient SQL or connection behavior may be the first constraint.
- Why inspect task-level ECS data?
Service averages can hide skew and one hot/restarting task.
- Why can Lambda demand exceed its Invocations metric?
Throttled requests are rejected and do not count as Invocations.
Lesson acceptance
- One absolute UTC window and workload shape are used across all correlated evidence.
- EC2/EBS findings include exact metric identities, meaningful statistics and guest/service boundaries.
- Database analysis distinguishes connections, resource utilization, DB load, waits and SQL/lock causes.
- ECS analysis distinguishes service average, task distribution, launch-type capacity and target behavior.
- Lambda analysis includes errors, throttles, duration tails, concurrency and event-source backlog.
- Each scenario has one evidence-backed change, explicit success threshold and rollback trigger.
- No unapproved paid platform is created; monitoring changes and P10 resources are restored or deleted.