Email Delivery Rate vs Inbox Placement: What Each Metric Proves
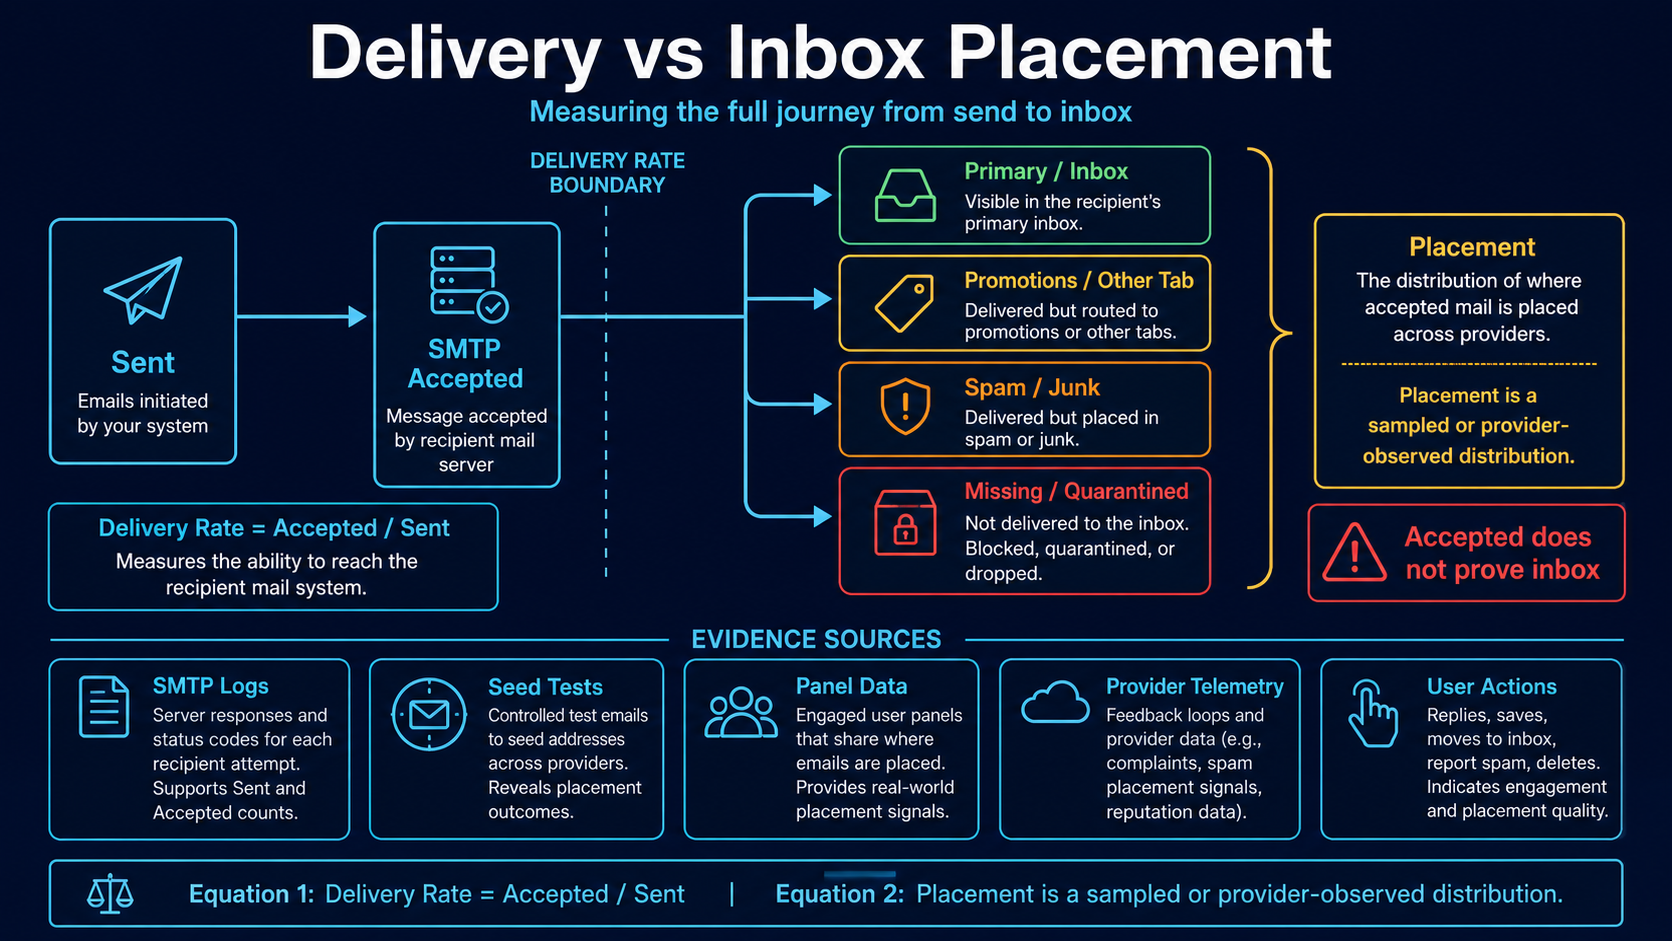
A receiving server can accept a message and later place it in the inbox, a category tab, junk, quarantine or another filtered state. Delivery rate measures the handoff boundary. Inbox placement describes what happens after that boundary, using evidence that is usually sampled or provider-specific. Treating the two as synonyms hides the most important part of a deliverability investigation.
Separate SMTP acceptance from mailbox placement
A consistent delivery rate starts with clear denominators. One common operational form is accepted recipients divided by attempted recipients, after defining whether suppressed addresses, pre-send validation failures and retries are included. A 2xx response after the recipient or message transaction proves the receiving system accepted responsibility under SMTP; it does not expose the final folder.
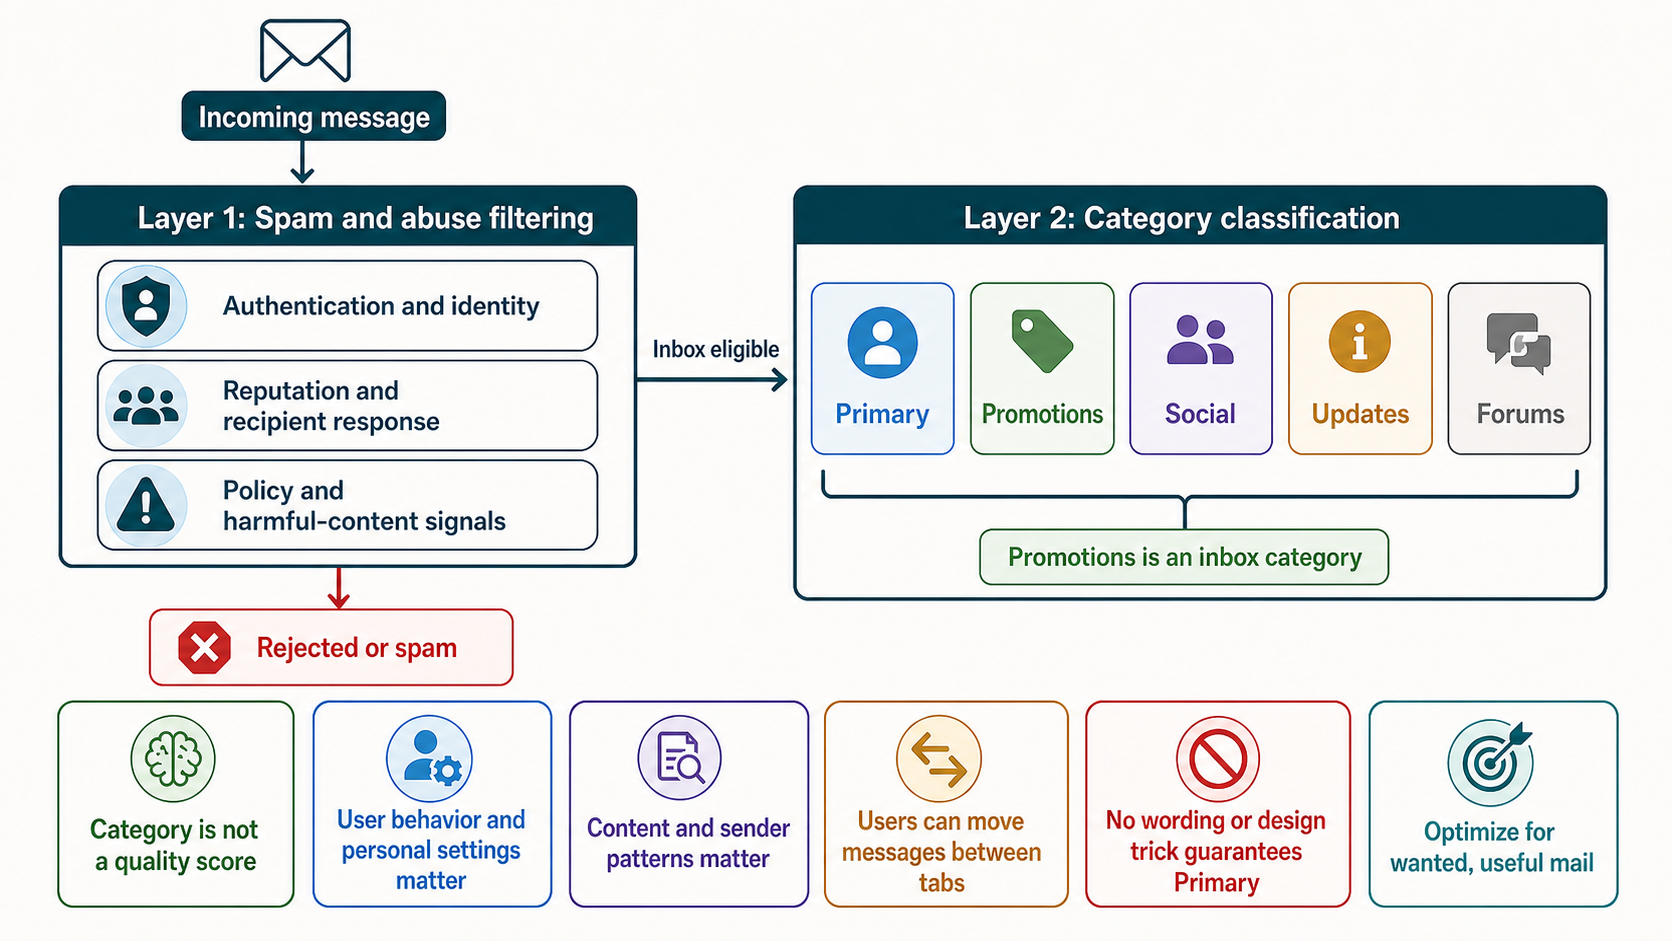
Placement can be observed through controlled seeds, participating panels, provider dashboards, security gateway logs and direct user reports. Each source covers a different population and has bias. Gmail tabs are inbox categories rather than spam, while enterprise gateways may quarantine a message before it reaches a user mailbox.
Why clicks, opens and seeds cannot answer alone
High delivery with falling clicks may indicate placement, content, tracking, seasonality or audience relevance. Low delivery may reflect invalid addresses, throttling, authentication or a provider incident before placement is considered. Start at the earliest proven failing boundary and move forward.
Open rates cannot resolve the question reliably because remote images can be blocked, prefetched or proxied. Placement vendors and seed networks also require method disclosure: provider mix, account behavior, sample size and observation period. A number without those details can create false precision.
Terminology must remain consistent across teams. An ESP may label all non-bounced recipients “delivered,” an analyst may subtract only hard bounces, and an operator may keep temporary deferrals open for several days. Publish the calculation version, terminal-state timing and late-delivery treatment. Otherwise two dashboards can disagree while both are internally correct, and a change in queue age can look like a reputation event.
Diagnose delivery and placement at the correct boundary
- Define sent and attempted. Document whether the metric begins after suppression, at queue insertion or at an actual SMTP recipient attempt.
- Classify SMTP outcomes. Separate accepted, transiently deferred, permanently rejected and still queued recipients without double-counting retries.
- Establish the delivery boundary. Calculate acceptance using one stable recipient-level rule and retain provider-specific results.
- Collect placement evidence. Use governed seeds, panel data, provider telemetry, enterprise quarantine evidence and direct recipient reports where available.
- Segment before diagnosing. Compare mailbox provider, domain, IP, campaign, cohort, acquisition source and message type rather than a blended total.
- Check authentication and headers. Validate SPF, DKIM, DMARC alignment, Received path, List-Unsubscribe and identity consistency in the delivered artifact.
- Correlate customer outcomes. Review clicks, replies, conversions, complaints and unsubscribes while accounting for tracking and privacy limitations.
- State confidence and limits. Report what is measured directly, what is sampled, the observation window and which populations are not visible.
Map observed patterns to the next evidence source
| Pattern | Likely boundary | Next evidence |
|---|---|---|
| Rejections rise and acceptance falls | Transport or receiver policy | Full SMTP replies, queues, authentication and rate |
| Acceptance stable; seeds shift to junk | Placement symptom | Provider telemetry, cohort and recent program changes |
| Seeds remain inbox; clicks fall broadly | Content, tracking or demand may dominate | Link tests, analytics, offer and audience behavior |
| Consumer inbox stable; business mail quarantined | Gateway security path | Gateway verdict, URLs, attachments and headers |
| Tabs change but spam does not | Inbox categorization | User expectations and engagement, not spam claims |
Worked case: 99 percent accepted but junk placement rises
A sender reports 99 percent “deliverability” because almost every recipient is accepted. Revenue and clicks fall at one provider. Seed observations show junk placement there, while SMTP acceptance remains unchanged. The sender therefore has a post-acceptance placement problem, not a delivery-rate failure.
Analysis finds a sudden expansion into an old inactive cohort. Complaints and negative engagement rise at the same provider. The sender pauses that cohort and restores controlled volume. It reports accepted-recipient rate separately from sampled placement and business response, allowing operations and marketing to work on the same evidence instead of debating one overloaded metric.
Delivery, placement and audience evidence to retain
- Delivery: attempted recipients, accepted recipients, 4xx, 5xx, queued, expired, provider and calculation version.
- Placement: evidence source, sample or panel definition, mailbox environment, folder or tab, time and confidence limitation.
- Identity: sending IP, reverse DNS, SPF, DKIM, DMARC, From, return path, links and message category.
- Audience: acquisition, consent, lifecycle, engagement recency, frequency, complaints, unsubscribes and bounce history.
- Business: qualified clicks, replies, conversions, revenue, margin and tracking coverage by provider and cohort.
Measurement errors that hide the failing boundary
- Calling acceptance inboxing: SMTP has no standard reply that reports the user’s final folder.
- Calling Promotions spam: category tabs are inbox organization, not the junk folder.
- Turning a seed sample into a universal rate: disclose sample method and provider coverage.
- Using opens as placement proof: privacy and image handling distort them.
- Blending providers: a large healthy provider can hide a serious regional or enterprise failure.
Delivery and placement reporting checklist
- Define the recipient-level sent and attempted denominator.
- Keep accepted, deferred, rejected, queued and expired states distinct.
- Report delivery and placement as separate measures.
- Document seed or panel population and behavior.
- Segment results by provider, stream, cohort and identity.
- Inspect raw headers and complete SMTP replies.
- Correlate placement evidence with complaints and business outcomes.
- State uncertainty and avoid unsupported inbox percentages.
Publish the exact delivery denominator and terminal time
attempted recipients = recipients with at least one SMTP delivery attempt
accepted recipients  = recipients receiving final SMTP acceptance
permanent failures   = terminal 5xx recipient outcomes
queued recipients    = still awaiting a terminal outcome
expired recipients   = queue lifetime ended without acceptance

acceptance rate = accepted recipients / attempted recipients × 100
Do not count retries as new recipients. State the reporting cutoff because a temporary deferral can become accepted or expire later. Suppressed recipients that never reached an SMTP attempt belong in selection reporting, not silently inside the transport denominator.
Calculate delivery without calling it inbox placement
| Recipient state at cutoff | Count |
|---|---|
| Accepted | 97,500 |
| Permanent rejection | 1,200 |
| Still queued | 900 |
| Expired | 400 |
| Total attempted | 100,000 |
The acceptance rate at this cutoff is 97.5%. The 900 queued recipients remain unresolved and must not be silently treated as accepted. Nothing in these transport counts identifies inbox, category tab, junk or quarantine placement.
If a seed panel reports 8 inbox observations, 1 category and 1 junk observation, describe that controlled sample separately. Do not multiply those proportions by 97,500 and present estimated recipient counts without a defensible sampling model.
Combine direct, sampled and behavioral evidence
| Evidence | Directly supports | Limitation |
|---|---|---|
| SMTP logs | Attempt, deferral, rejection and acceptance | No final folder visibility |
| Raw delivered headers | Path, authentication and processing evidence for that message | One recipient/message |
| Controlled seeds | Folder and rendering observation for controlled accounts | Small, behavior-sensitive sample |
| Provider telemetry | Provider-specific reputation, complaint or delivery indicators | Definitions and coverage vary |
| Enterprise gateway logs | Gateway verdict and quarantine path | Only participating organizations |
| Clicks, replies and conversions | Observed customer actions | Affected by demand, content and tracking |
| Open pixels | Image request under client/privacy behavior | Cannot reliably prove human view or placement |
Start diagnosis at the earliest failing boundary
- Was the message selected? Check consent, suppression and campaign eligibility.
- Was an SMTP attempt made? Check queue insertion, DNS and route.
- Was it accepted? Inspect complete 4xx/5xx replies and terminal state.
- Did controlled evidence show junk or quarantine? Review seeds, provider telemetry and gateway verdicts.
- Did authentication and identity remain consistent? Inspect delivered headers, DKIM, SPF, DMARC and links.
- Did customer response change despite stable placement evidence? Test content, offer, tracking, seasonality and audience relevance.
This order prevents a tracking outage from being called a reputation incident and prevents a transport rejection from being investigated as an HTML rendering problem.
Build a dashboard that cannot hide provider incidents
| Layer | Segment by | Required outcomes |
|---|---|---|
| Selection | Program, consent source and suppression reason | Eligible and excluded recipients |
| Transport | Receiving organization, MX, IP and stream | Accepted, 4xx, 5xx, queued and expired |
| Placement evidence | Provider, seed/panel method and environment | Inbox, category, junk, quarantine and unknown |
| Audience safety | Cohort and acquisition source | Complaints, unsubscribes and hard bounces |
| Business | Provider, campaign and lifecycle | Qualified actions, conversion and margin |
Show numerator, denominator, cutoff and method version. A blended global percentage can remain stable while a smaller provider or enterprise gateway is failing severely.
Distinguish placement recovery from business recovery
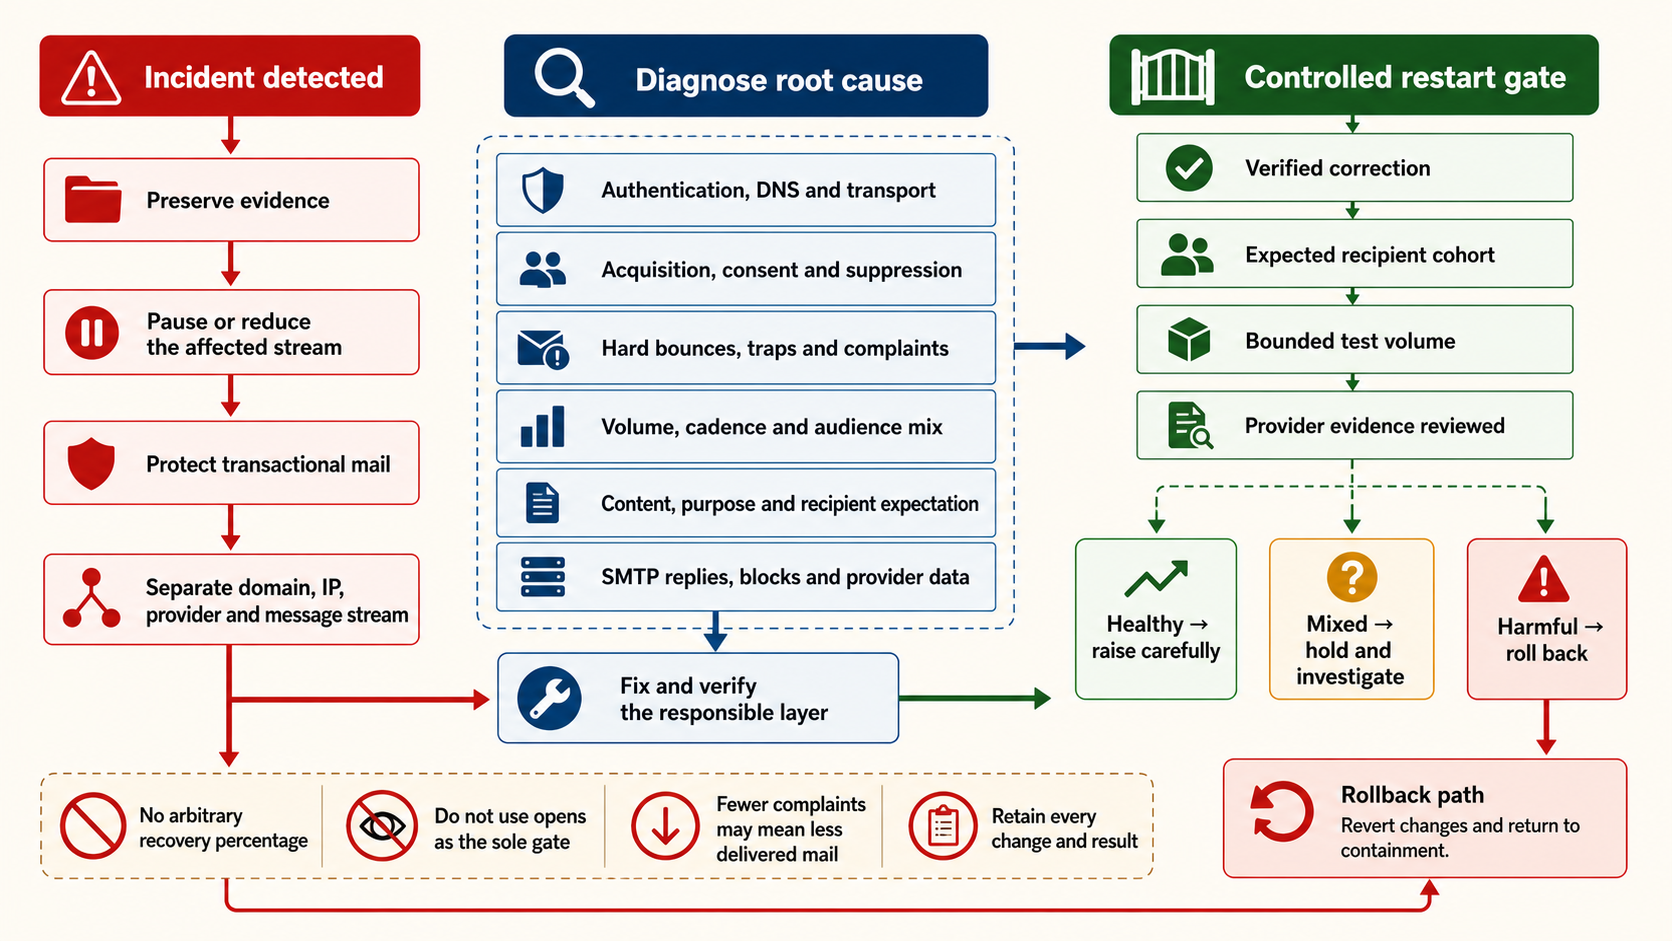
After the inactive cohort is paused, controlled seeds return to the inbox and provider complaint indicators improve. That supports placement recovery for the observed environment. The team still watches production clicks, replies, conversions and customer reports because a technically recovered route does not guarantee that content and demand have recovered.
Close the incident only when the original boundary is repaired and independent signals agree. Record unresolved uncertainty, especially where final folder placement is not directly observable for the broader population.
Classify category tabs, junk and quarantine separately
| Outcome | Meaning | Investigation |
|---|---|---|
| Primary/personal inbox | Visible inbox category for that account | Confirm expected message type and user preference |
| Promotions or another category | Inbox organization, not necessarily spam | Evaluate content classification and subscriber expectation |
| Junk/spam | Mailbox filtering after acceptance | Provider reputation, complaints, audience, authentication and content |
| Gateway quarantine | Enterprise security control intercepted mail | Gateway verdict, links, attachments, authentication and tenant policy |
| Missing | Unknown until transport and mailbox evidence are checked | Queue, SMTP response, delay, filters and message search |
Do not combine category tabs with junk in a single “not inbox” failure rate. The recipient experience and corrective action are different.
Attach confidence and coverage to every placement claim
State whether evidence is direct for one message, sampled from controlled accounts, modeled from a panel or inferred from behavior. Include provider coverage, sample size, account behavior, observation period and missing populations.
A useful conclusion might read: “SMTP acceptance remained stable at Microsoft consumer domains; three controlled Outlook seeds moved to junk in two consecutive runs; SNDS and JMRP also worsened after the same cohort expansion.” This is stronger than “inbox rate fell” because every boundary and limitation is visible.
Separate each observable boundary in the delivery path
selected -> submitted -> attempted -> accepted_by_mx
         -> mailbox_processed -> folder_observed
         -> human_or_machine_interaction -> business_outcome
An SMTP 250 after DATA means the receiving system accepted responsibility for the message. It does not prove inbox folder, tab, visibility or reading. An ESP “delivered” metric usually means accepted minus known bounces, not human delivery. Document the exact event used in every rate.
Folder placement is often observable only through controlled seeds, panels or recipient-side data, each with sampling and instrumentation limits. Opens are not a folder oracle because privacy fetches and image blocking distort them.
Use denominators that reconcile across the funnel
| Metric | Illustrative definition | Primary use |
|---|---|---|
| Submission success | Accepted by sender platform / selected | Internal pipeline |
| MX acceptance | Recipients accepted after DATA / attempted | Transport outcome |
| Observed seed inbox | Inbox observations / observable seed deliveries | Controlled placement comparison |
| Complaint rate | Provider complaints / provider denominator | Recipient dissatisfaction |
| Conversion rate | Matured outcomes / assigned or delivered population | Business result |
Always publish counts, window, timezone, data delay and unknowns. Provider complaint denominators may differ from ESP calculations, so do not force them to match.
Diagnose a drop at the correct layer
| Observation | Likely layer | Next evidence |
|---|---|---|
| Permanent SMTP rejects rise | Recipient, authentication or policy | Full replies and received identities |
| Temporary deferrals and queue age rise | Rate, reputation or receiver capacity | Provider-hour traffic and retry behavior |
| Acceptance stable, seed spam rises | Placement hypothesis | Repeat seeds plus provider and production signals |
| Clicks fall while acceptance stable | Content, audience, rendering or measurement | Qualified click path and experiment |
| Revenue falls with stable clicks | Offer/site/attribution | Conversion funnel and holdout |
Do not call every performance decline a deliverability issue. Establish the earliest boundary where evidence changed.
Worked incident: accepted volume is stable but outcomes collapse
A campaign dashboard reports 98.7% delivered, unchanged from the previous month, while qualified clicks fall by half at Microsoft recipients. SMTP acceptance and queue delay remain stable. Seeds show several Outlook accounts in junk, but the sample is small.
The team treats placement as a hypothesis. It correlates SNDS, JMRP, full Microsoft replies, campaign cohorts, From/DKIM identity and complaint changes. A newly reactivated inactive segment drove complaints while transport acceptance remained high. It stops that cohort, preserves current subscribers, fixes sunset controls and resumes in stages.
Recovery requires complaint and recipient outcomes to normalize across matured windows; one green seed is insufficient. This case demonstrates why “delivered” can remain high during a reputation problem and why folder claims require more than SMTP data.
Build one reconciled transport, placement and outcome model
message_recipient(
  recipient_key, message_id, campaign_id, provider_org,
  selected_at, attempted_at, smtp_final_at,
  smtp_class, enhanced_code, outbound_ip,
  from_domain, dkim_domain, experiment_assignment
)
observation(
  message_id, observation_type, observed_at,
  value, confidence, source, classifier_version
)
Keep raw SMTP events separate from derived “delivered.” Attach seed placement, qualified interaction and conversion as observations with their own source and confidence. This prevents one ambiguous status column from mixing a receiver handoff with an inbox claim.
| Question | Minimum evidence | Limitation to publish |
|---|---|---|
| Did our platform attempt? | Queue and route event | Attempt does not mean remote acceptance |
| Did receiving MX accept? | Final positive SMTP reply after DATA | Does not identify folder |
| Was a seed observed in inbox? | Healthy observer and matched message | Artificial account sample |
| Did a person interact? | Qualified click, reply or authenticated action | Scanners and identity gaps |
| Did email cause value? | Randomized or credible causal comparison | Population and experiment assumptions |
Reconcile selected, excluded, attempted, accepted, deferred, rejected and expired counts. A recipient can generate multiple temporary events before one final result, so event counts cannot be used as recipient denominators. Keep queue lifetime expiry distinct from a remote permanent rejection.
For incident detection, build provider-hour acceptance and queue-age panels, provider-day complaint and reputation panels, and campaign-level qualified outcome panels. Their time grains differ. A complaint arriving today may belong to a message sent days ago; attribute it to the send cohort while retaining arrival time.
Use seed or panel data to support a placement statement only with sample count, account design, observer health and unknowns. Phrase conclusions as observed evidence, not universal inbox rate. Confirm important changes with production signals and controlled tests.
Report the layers without making an inbox promise
A useful weekly report begins with transport: attempted, accepted, deferred, rejected and expired by receiving organization. It then shows recipient safety: complaints, unsubscribes and hard bounces with their native denominators. Placement observations follow with panel size and unknown state. Qualified interaction and incremental business outcome appear last.
Do not combine these layers into one deliverability score. A high score can hide stable acceptance with rising complaints, while a low open rate can reflect privacy or rendering rather than placement. Add annotations for campaign mix, acquisition changes, authentication releases, route changes and measurement classifier versions.
When communicating an incident, say “Microsoft MX acceptance remained stable; five of six controlled Outlook seeds were observed in junk; JMRP complaints increased in the reactivated cohort.” That statement is more useful than “delivery fell.” It shows known evidence, sample boundary and likely causal population. The recovery statement should use the same measures and matured time windows.
Use controlled experiments when placement changes are uncertain
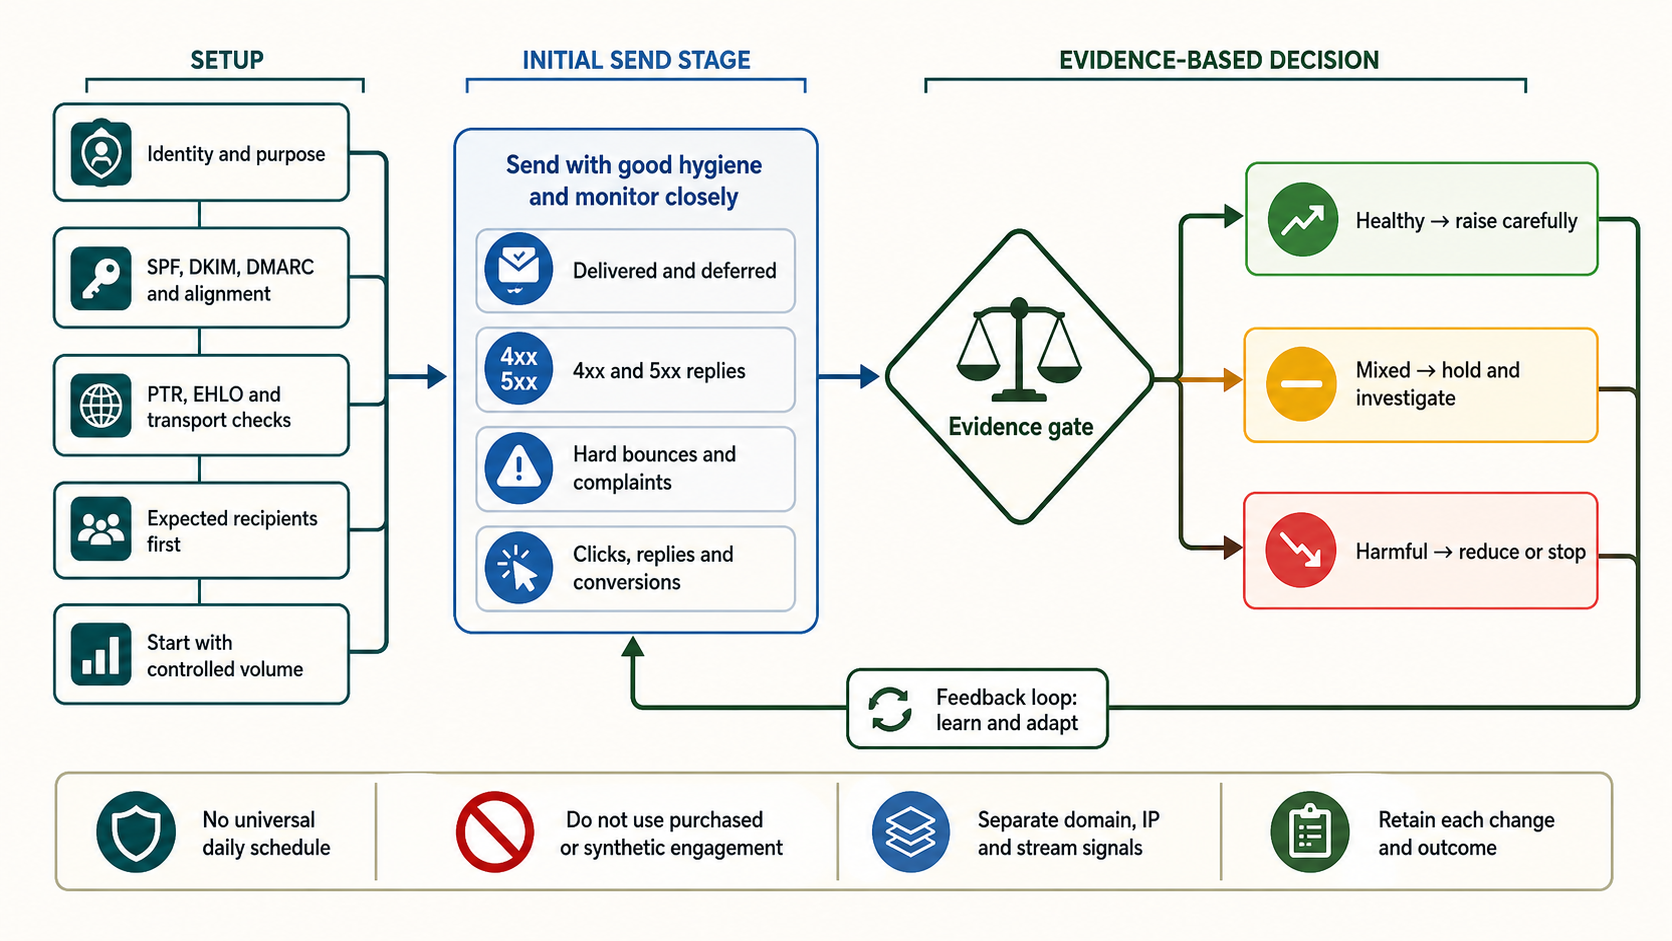
Randomly split an eligible homogeneous cohort between the current and proposed message or route while holding identity, timing and audience policy stable. Measure SMTP outcomes, complaints, qualified interaction and business outcome. Run the same variants across a balanced seed panel for diagnostic evidence, but do not use seeds as the experiment population.
Predefine the primary decision and stop condition. If transport acceptance differs, diagnose infrastructure first. If acceptance is stable but recipient outcomes differ, examine rendering, offer, audience and placement evidence. Avoid selecting whichever metric makes the change look successful.
Retain assignment even when delivery fails. Filtering and bounces are part of treatment impact. Report confidence or uncertainty, provider distribution and any contamination. This is more reliable than sending one version today and another next week, when traffic, provider policy and audience can all change.
Use precise language in every dashboard and article
Label SMTP acceptance as acceptance, seed inbox observation as observed placement, image requests as opens or fetches with their limitation, and experimental lift as incremental only when design supports it. Definitions should appear beside metrics and remain versioned. Precise language prevents executives, marketers and operators from solving the wrong layer of the system. It also makes incident recovery measurable.